

The market has entered a period of calm, with trading volumes falling to a nine-month low and volatility hitting a 21-month low, suggesting that despite the active dynamics in July, the market may be heading for a summer slowdown.
Based on the experience of the past four years, every July is accompanied by a shock event, either bullish or bearish, but prices remain strong, and traders seem to prefer "enjoying life" rather than watching the market. Is it just wishful thinking to expect this year to be different?
July Outlook – Another Quiet Summer?
It’s a busy month ahead. Trump’s actions continue to impact markets, distort risk sentiment, and drive Bitcoin’s price. July will be dominated by Trump’s potential impact: the “big, beautiful” budget, the end of the tariff moratorium, and the latest crypto executive order deadline are all scheduled this month.
- Budget: Trump signed the "Big, Beautiful" budget on July 5. The bill is controversial for its expansionary nature and could increase the U.S. deficit by $3.3 trillion. An expansionary fiscal budget is bullish for scarce assets like Bitcoin, but this positive may be overshadowed by the renewed tariff discussion.
- Tariff issues: The 90-day tariff exemption period will end on July 9, and Trump is expected to make more comments on different countries. The impact of new tariffs will be gradually disclosed and adjusted throughout the month. Looking back at the experience from February to April, tariff uncertainty can easily suppress market sentiment and have a negative impact on Bitcoin.
- Crypto Executive Order: The third possible development is US policy related to cryptocurrencies. July 22 is the final deadline for the latest crypto executive order, when the working group will submit a report proposing legislation and regulatory frameworks and assessing the US digital asset reserves. The reserves were previously affected by an executive order called the "Strategic Bitcoin Reserve". Although all deadlines for the order have passed, information about the current number of Bitcoins held by the US government, future purchase plans, or compensation to victims such as Bitfinex has not been made public. Even if no more information is released after July 22, decisions and announcements around the SBR may still be made at any time.
All of these events could affect BTC, depending on which factor dominates, fiscal expansion or trade uncertainty. In addition, reduced liquidity due to the July 4th U.S. Independence Day holiday could increase near-term market uncertainty and make traders reluctant to take risks.
The evolving Trump trade and market sentiment
It is an indisputable fact that Trump’s actions have stirred the market. In the six months since he took office, global uncertainty has increased, causing the market (especially the crypto market) to become more sluggish. Judging from indicators such as funding rates, open interest, leveraged ETF exposure, trading volume and option skew, it is hard to imagine that Bitcoin is only 5% away from its all-time high.
In the current uncertainty-dominated environment, the market's risk appetite is expressed very mildly through the above-mentioned financial instruments, which puts prices and risk tolerance in a completely different structural state from previous bull market periods.
This suppressed risk appetite can be interpreted as a positive signal for the future of Bitcoin. Limited enthusiasm means that if the market picks up in the future, the risk of liquidation will be lower. There is no reason for large-scale deleveraging in the market at present, and the overall leverage level is still under control, which is more suitable for continuing to hold spot and being patient in this seasonally weak market.
History repeating itself or breaking the mold?
Looking back over the period 2021 to 2024, July is the second least active month of the year in terms of trading volume, despite Julys in past years being filled with market-moving headlines.
- In July 2021, BTC prices plummeted to yearly lows after China banned BTC mining;
- In July 2022, Three Arrows Capital and Celsius entered bankruptcy proceedings;
- Although 2023 was relatively quiet, BlackRock submitted an application for a BTC ETF;
- 2024 is particularly turbulent. At the beginning of the month, Mt. Gox began to distribute assets and the German government sold Bitcoin. In the middle of the month, Trump suffered an assassination attempt and attended the BTC conference. At the end of the month, Biden withdrew from the presidential election.
In an environment where there are no signs of market overheating, it may be a safer strategy to continue holding spot and remain patient.
In-depth analysis of market data
Spot market performance
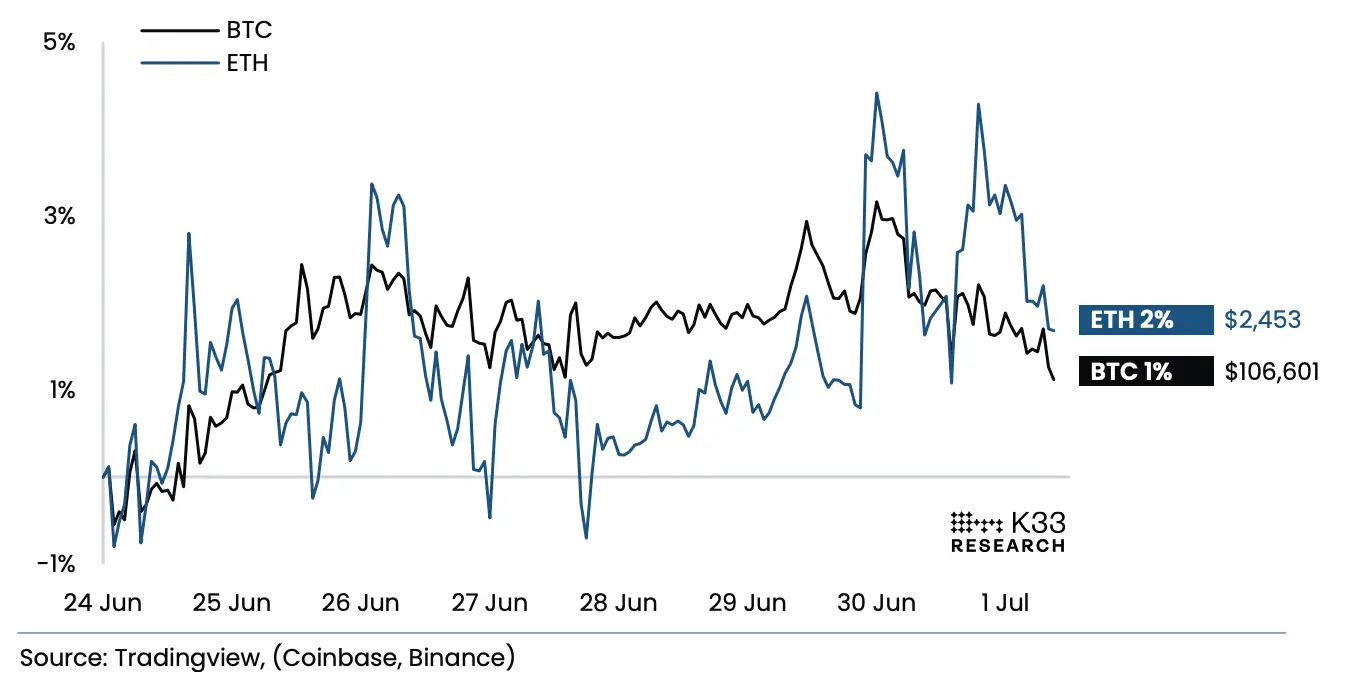
Figure 2: BTC and ETH performance last week
Spot market trading activity weakened further over the past seven days, with average daily volume (ADV) down 34% from the previous week and the 7-day ADV down to $2.18 billion, the lowest recorded since October 15, 2024. This subdued activity was driven primarily by narrow consolidation ranges and a relatively quiet news story.
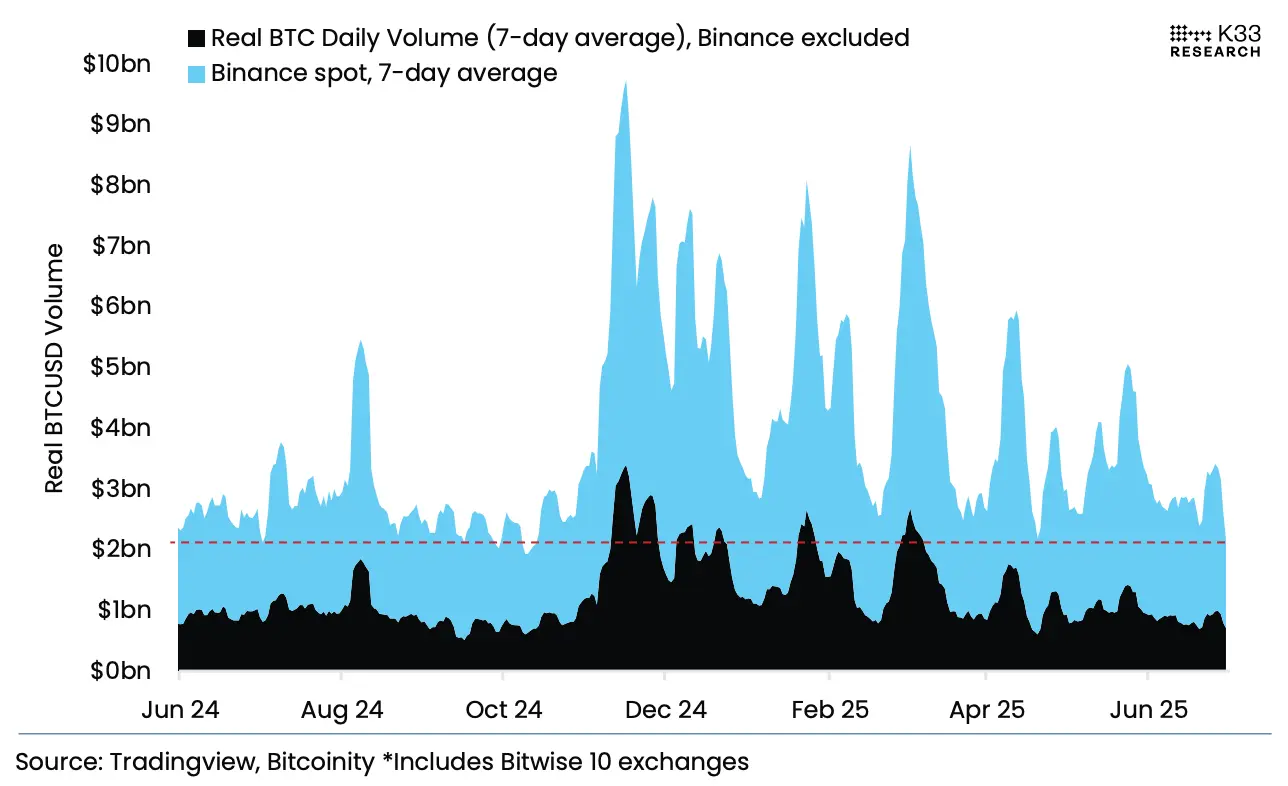
Figure 4: Actual BTC/USD daily trading volume* (7-day average)

Figure 16: Percentage of Bitcoin transaction volume in each month from 2021 to 2024 (average + 2024 data)
Bitcoin spot trading volume fell in June 2025 to its lowest level since September 2024, continuing a generally sluggish trading trend during the summer. Historical data shows that June to October only accounts for 43% of the year, but only contributes 32% of annual trading volume. Historically, July (6.1% of annual trading volume) and September (6% of annual trading volume) are usually the quietest months of the year.
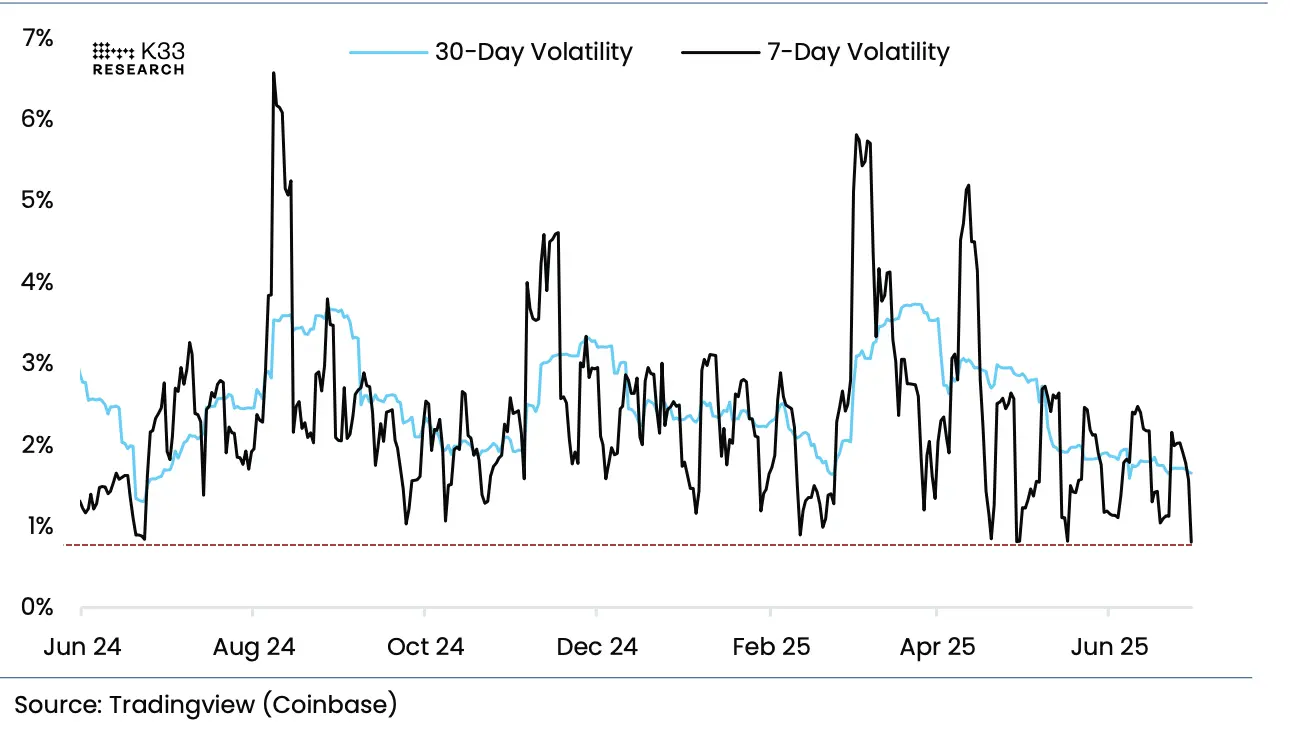
Figure 5: BTC-USD volatility
A similar pattern is seen in volatility, with 7-day volatility falling to 0.79%, the lowest since October 14, 2023. It is worth noting that the longest streak of such low 7-day volatility (below 1%) over the past year was only two days, suggesting that more substantial market moves may be in the near term.
Historical data shows that even against the backdrop of China’s mining ban in 2021, crypto bankruptcies in 2022, and major political events in 2024, average volatility in July, September, and October remained low.
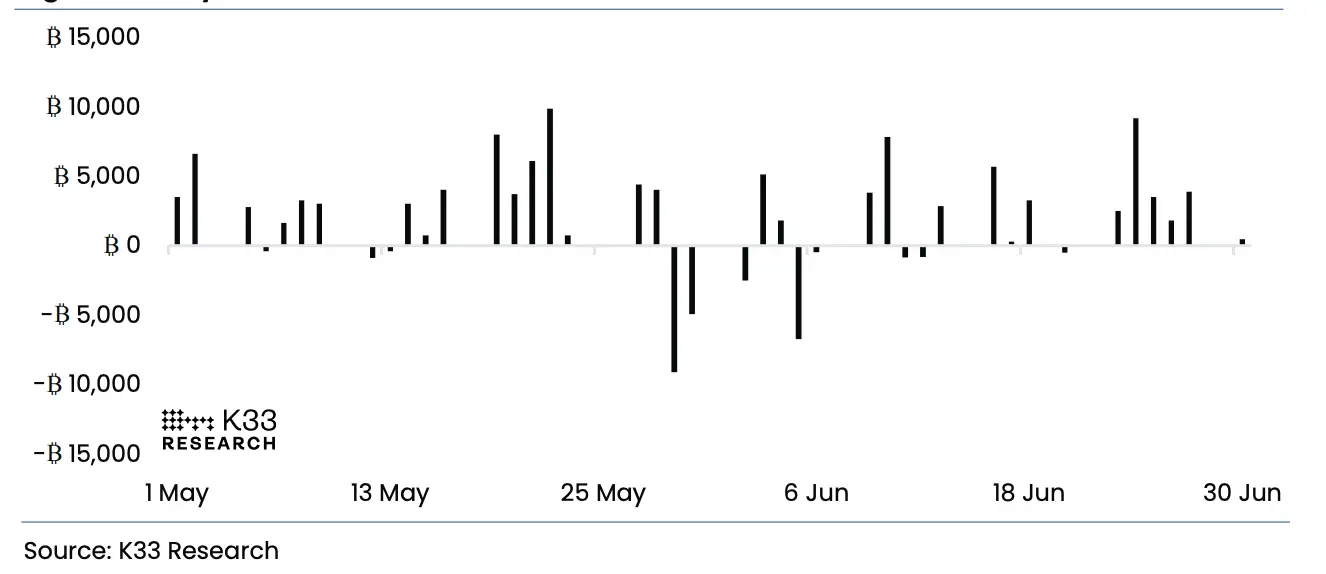
Figure 3: Global Daily Net BTC ETP Fund Flows
Despite the weak price action, flows have been strong. Bitcoin ETPs (Exchange Traded Products) recorded a net inflow of 18,877 BTC in the past week, almost entirely contributed by large inflows from US spot ETFs, setting the strongest weekly inflow record since May 28. However, the strong inflows are in stark contrast to the stagnant prices, indicating that there is considerable selling pressure in the market.
Therefore, despite the presence of multiple potential market catalysts in July 2025, based on past patterns, the market is likely to linger in a typical summer soft phase with low volumes and volatility.
Derivatives Market
Taken together, low CME futures premiums, limited leveraged ETF flows, and low leverage and modest yields in the perpetual contract market are signs that the risk of a leverage-driven market squeeze is limited in the near term.
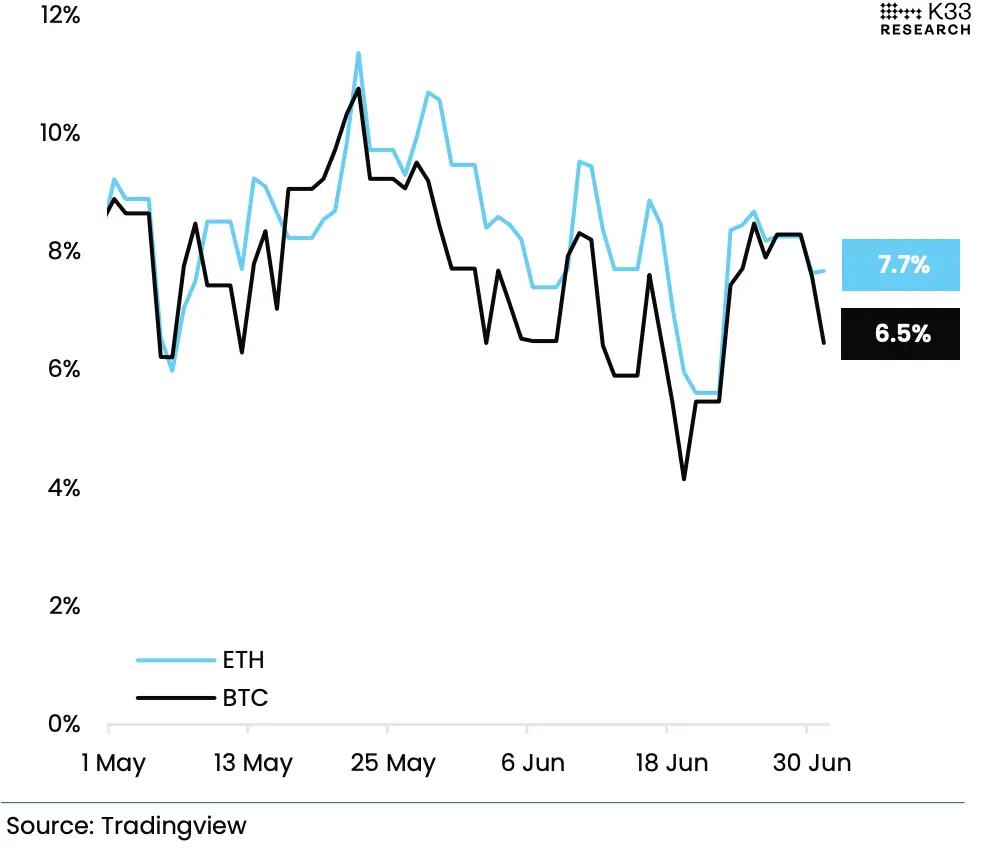
Figure 6: Caution prevails as we enter the second half of the year - CME BTC and ETH futures annualized rolling 1-month basis
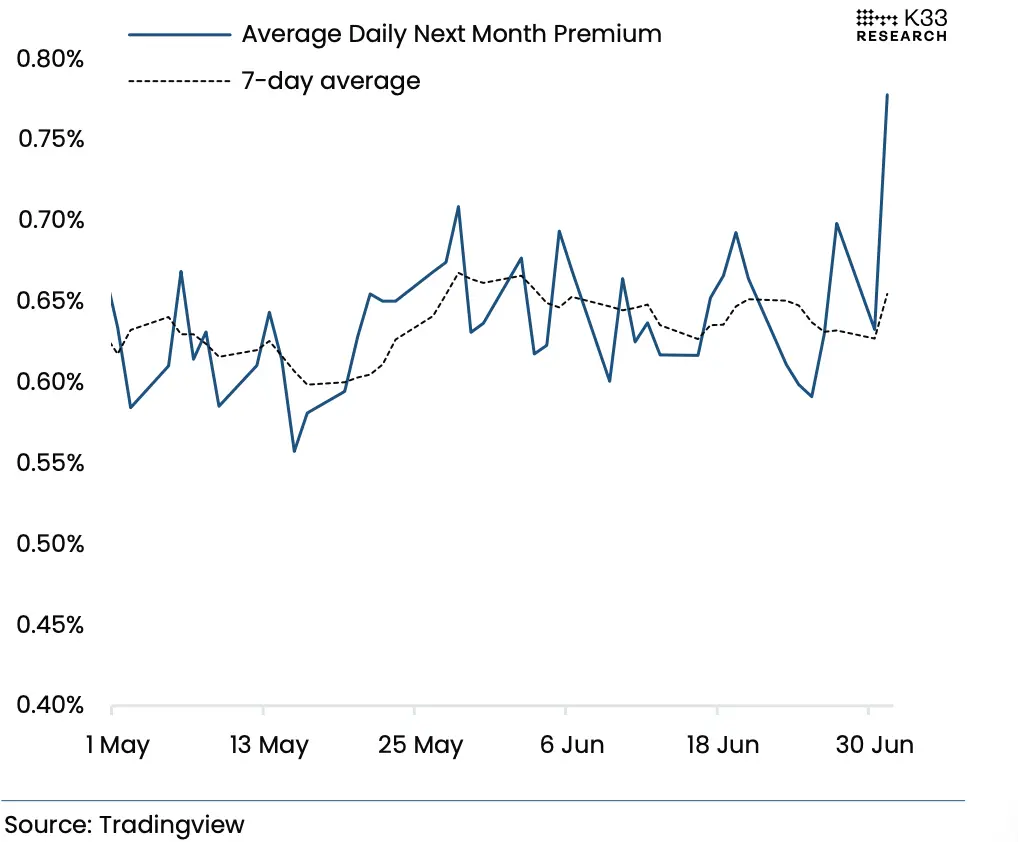
Figure 7: Futures premium widens, second month contract activity sluggish - CME BTC futures: second month average daily premium
- CME: CME cryptocurrency futures had a lackluster week as traders avoided new directional positions, and overall exposure remained flat despite the important June contract expiration. The annualized premium for Bitcoin futures remained weak, hovering around 7-8%, and slipped to 6.5% in early trading on Tuesday, the lowest level in the past 8 days.
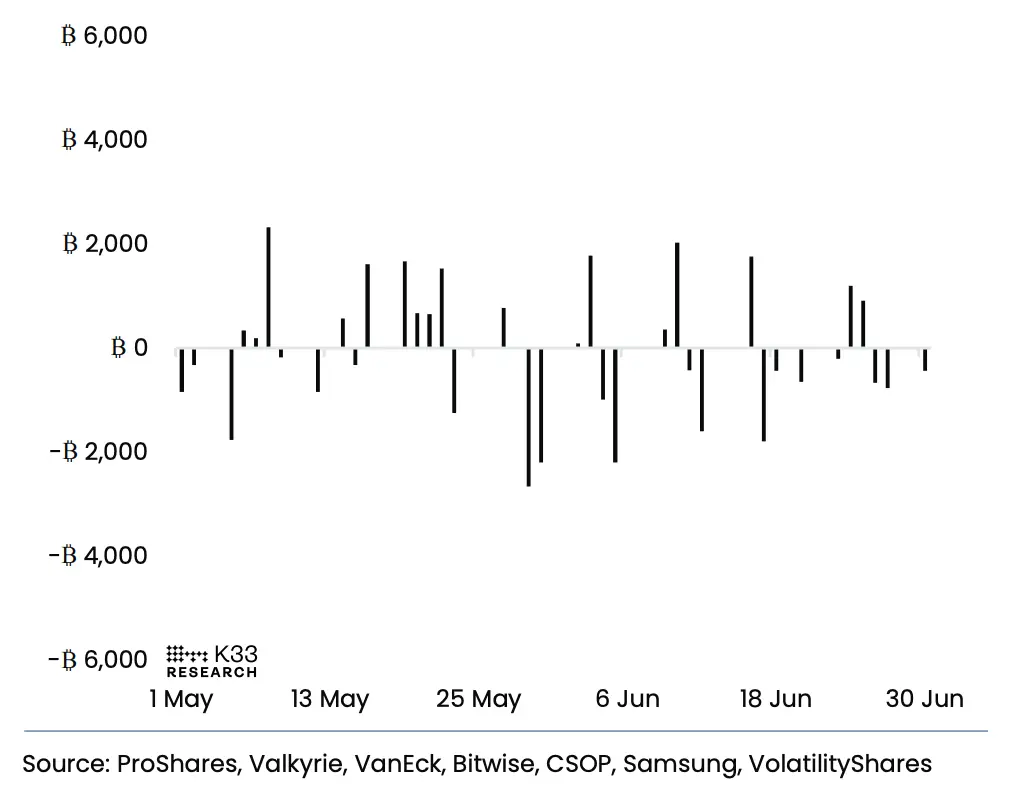
Figure 8: Futures ETF activity is muted – Futures-based ETFs: net inflows (in BTC equivalent)
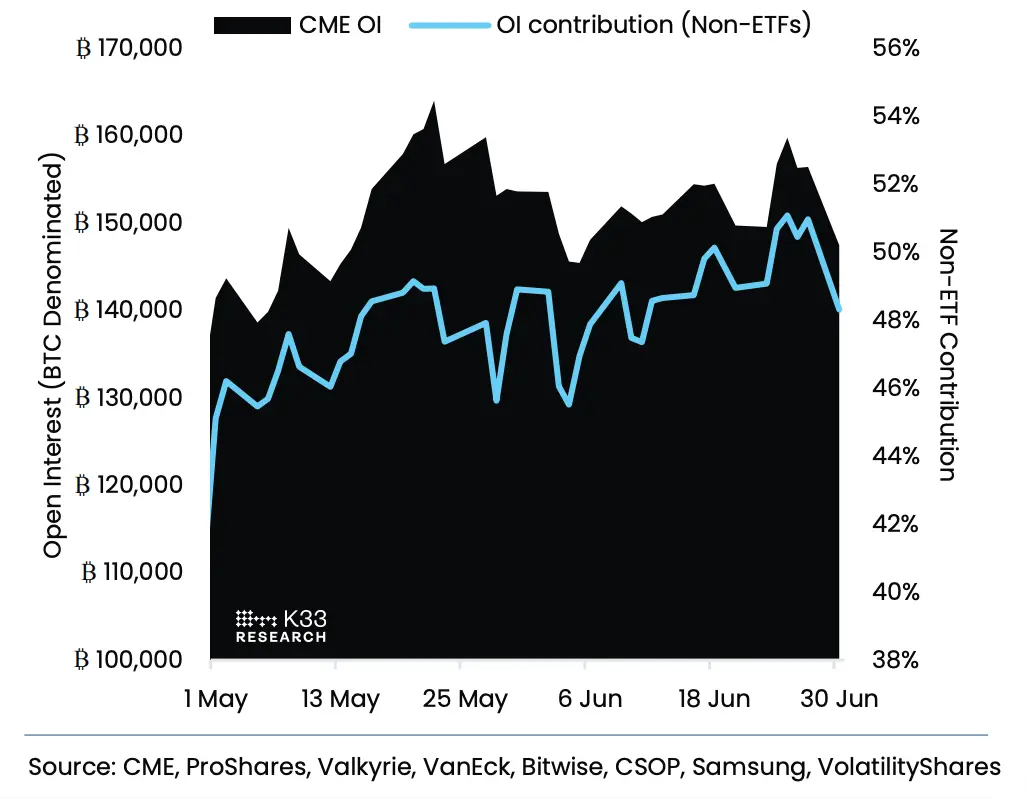
Figure 9: June expiry open interest decreased by 8,960 BTC – CME BTC Futures: Open Interest
- Leveraged ETFs: Leveraged ETF activity was similarly muted, with small outflows since Thursday, suggesting the market’s low-risk appetite remains solid. CME’s open interest fell by 2,105 BTC over the past week, driven primarily by traders holding onto 8,960 BTC worth of June contracts until expiration. Over the past two months, when Bitcoin’s price remained above $100,000, its open interest has been fluctuating in a narrow range of 145,000 to 160,000 BTC.
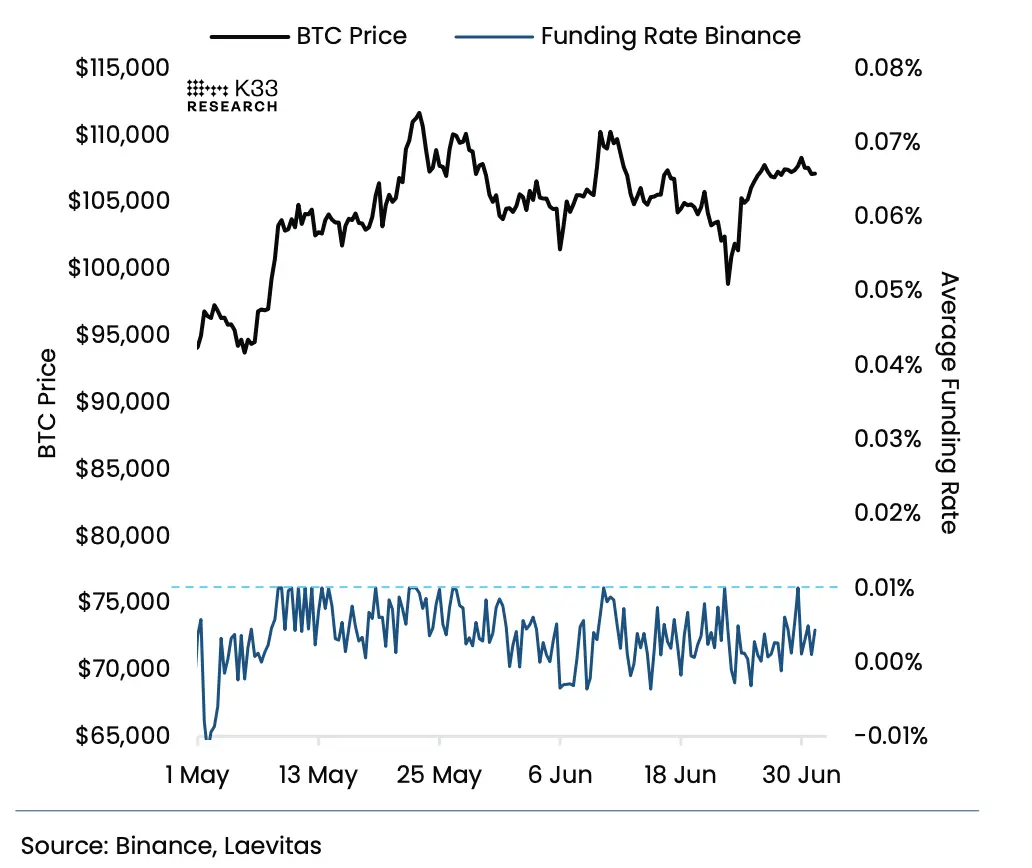
Figure 10: Perpetual contracts show no signs of risk appetite - Bitcoin perpetual contracts: funding rate vs. BTC price
Figure 11: Stagnation in Perpetual Contract Activity – Bitcoin Perpetual Contract: Open Interest and
- Perpetual Swaps: The same cautious sentiment is reflected in the perpetual swap market. The 7-day annualized funding rate averages just 2.5%, well below the neutral level of 10.95%. This indicates a continued lack of willingness to establish new long positions, causing the price of perpetual swaps to remain below the spot price. Bitcoin perpetual swaps open interest remains well below the May high, essentially stagnating at 266,000 BTC, only slightly rebounding from last week's low of 257,000 BTC.
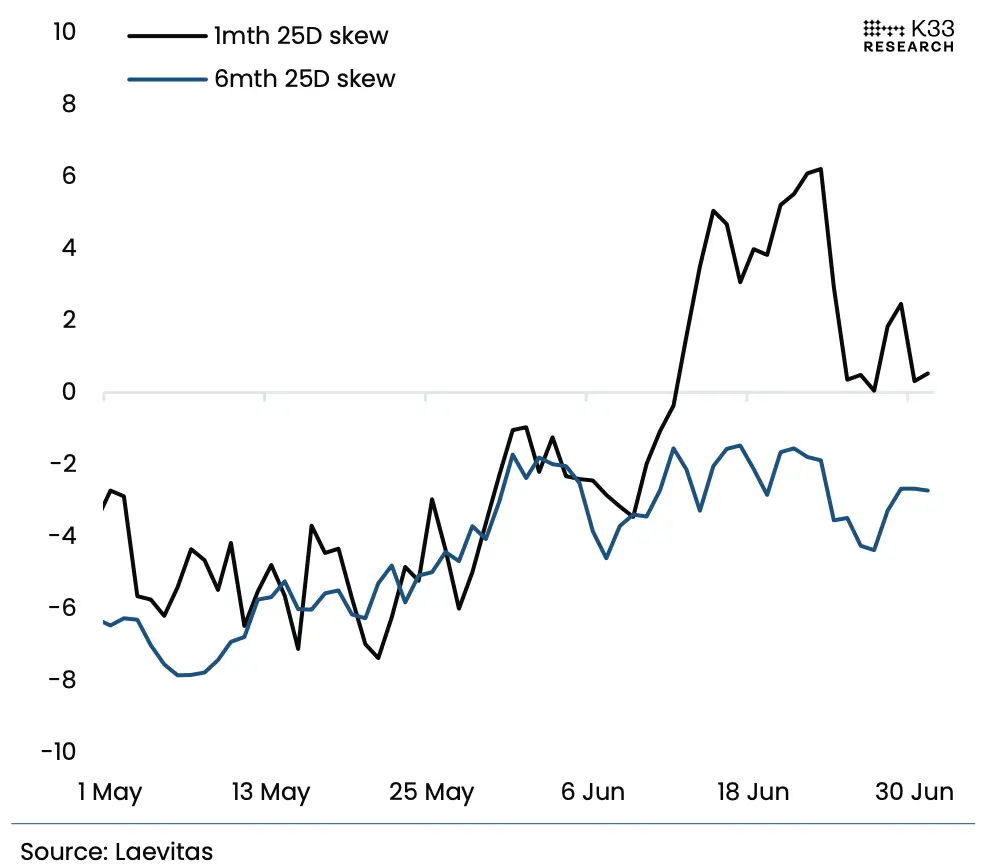
Figure 12: Skew of each term tends to be neutral - BTC options: 25Dskew (1 month + 6 months)
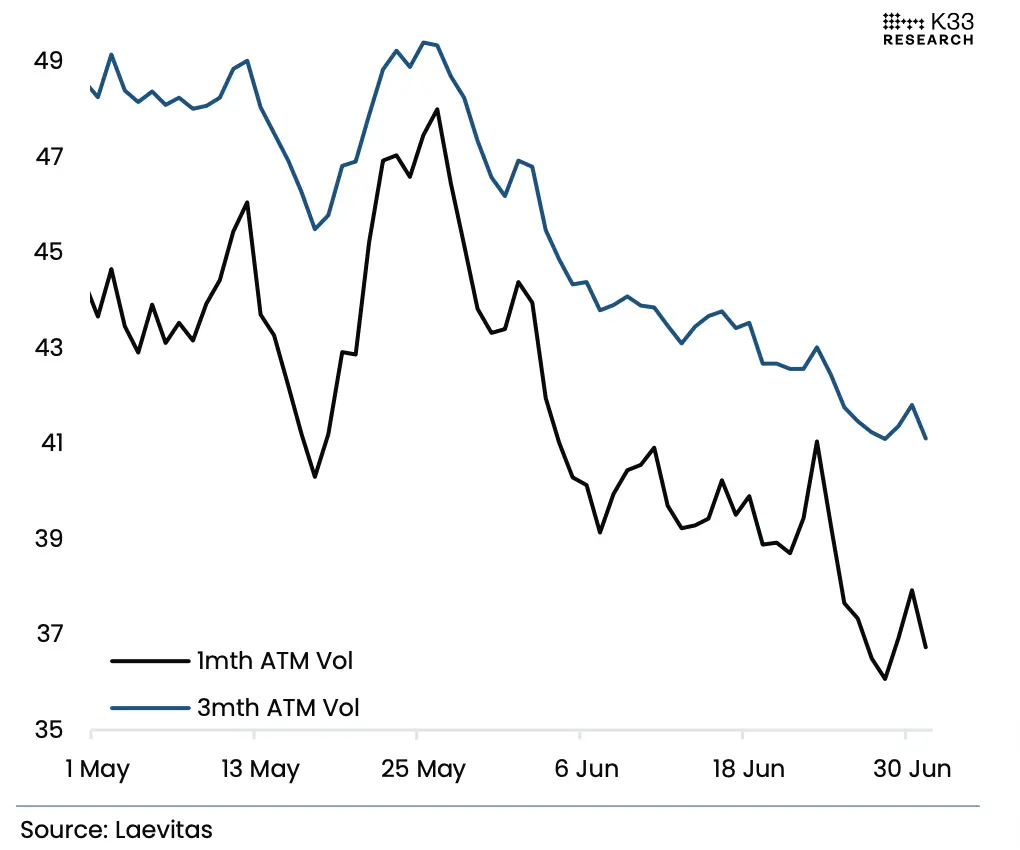
Figure 13: Implied volatility hits a new low for the year - BTC options: Implied volatility
- Options market: At the same time, in the Bitcoin options market, due to the long-term sideways price and reduced trading activities, the market's demand for directional bets has weakened, and the skew of various maturities has tended to be neutral. At the same time, the long-term consolidation has compressed the implied volatility to a new low for the year, and the market expects that the summer market will continue to advance slowly.
The rise of the Altcoin derivatives market
Relative leverage in the Altcoin market has risen dramatically over the past year. Perpetual open interest has nearly doubled relative to market capitalization, from 3% on July 1, 2024 to 5.6% today, indicating that leveraged trading in Altcoin is much more active than it was a year ago.
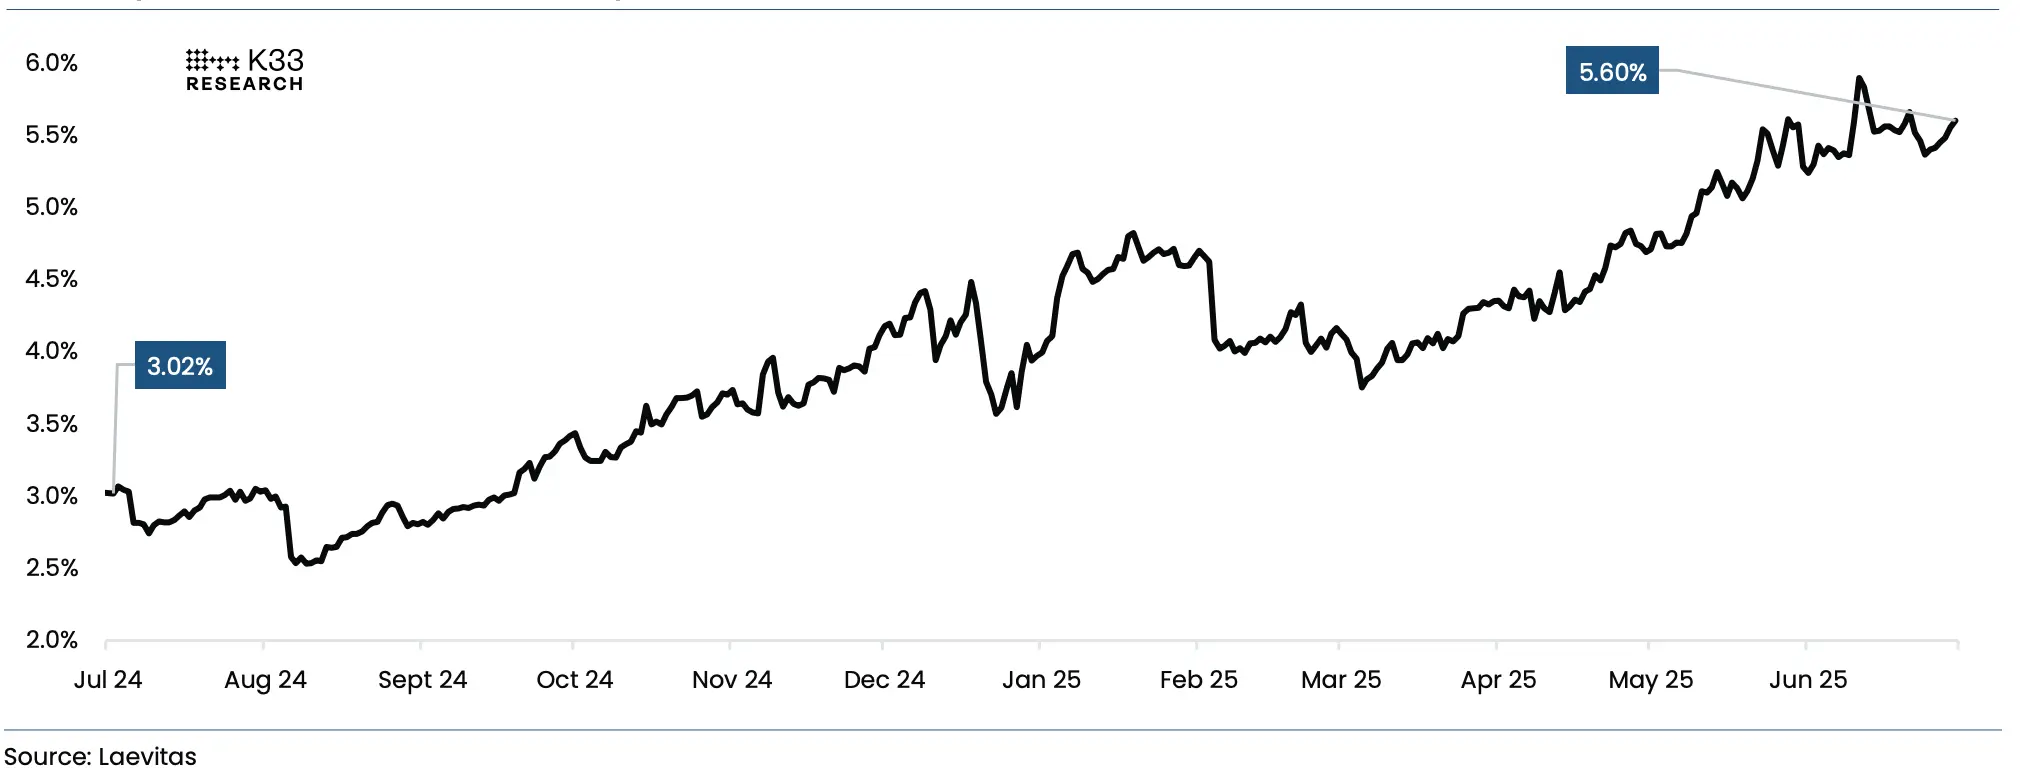
Figure 14: Open interest of Altcoin relative to market capitalization (OI/total market capitalization index, excluding USDT and USDC)
Ethereum’s notional open interest grew 68%, from 3.5 million ETH to 6.88 million ETH. Solana’s notional open interest grew 115%, from 13.2 million SOL to 28.3 million SOL. In contrast, Bitcoin’s open interest remained largely unchanged, from 263,000 BTC on July 1, 2024 to 266,000 BTC on July 1, 2025, highlighting that traders’ focus is increasingly shifting to Altcoin.
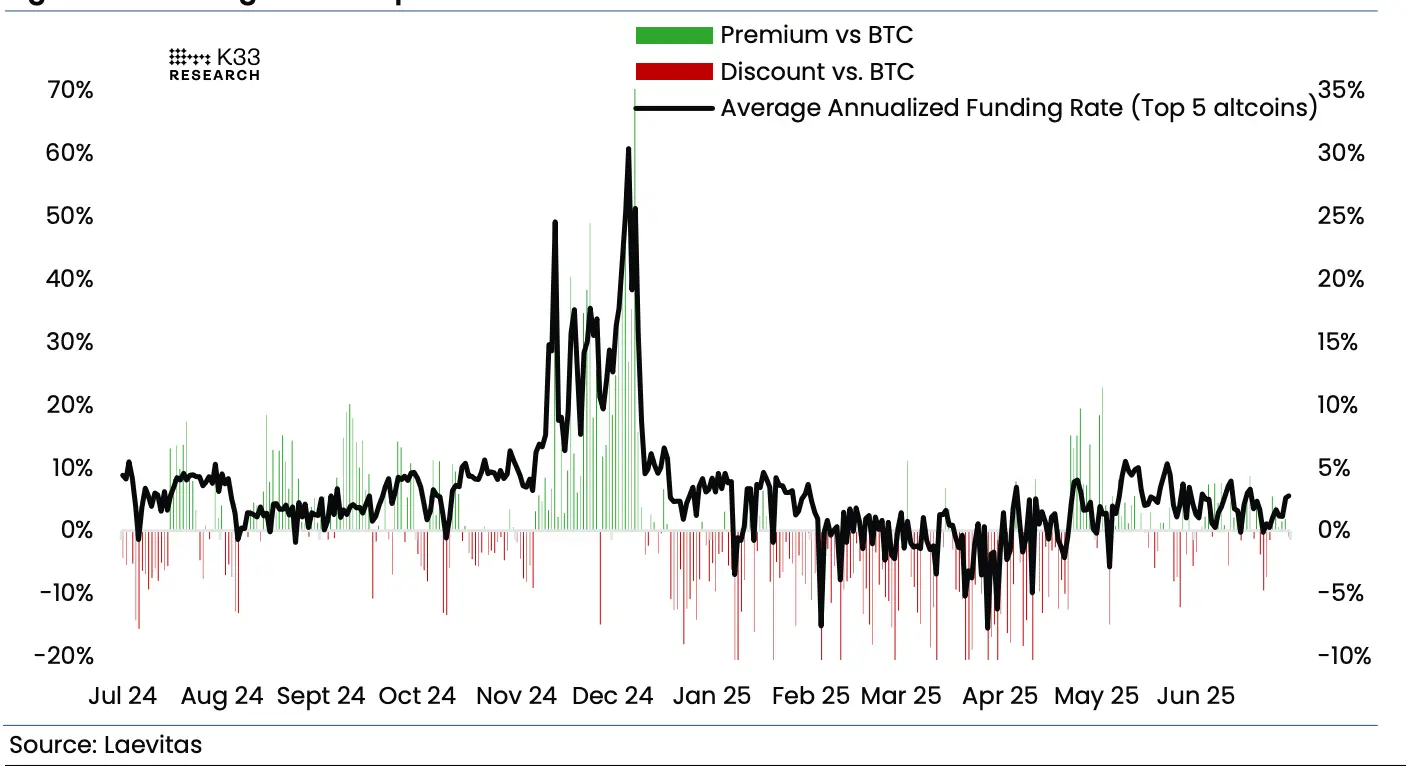
Figure 15: Funding Rate: Top 5 Altcoin
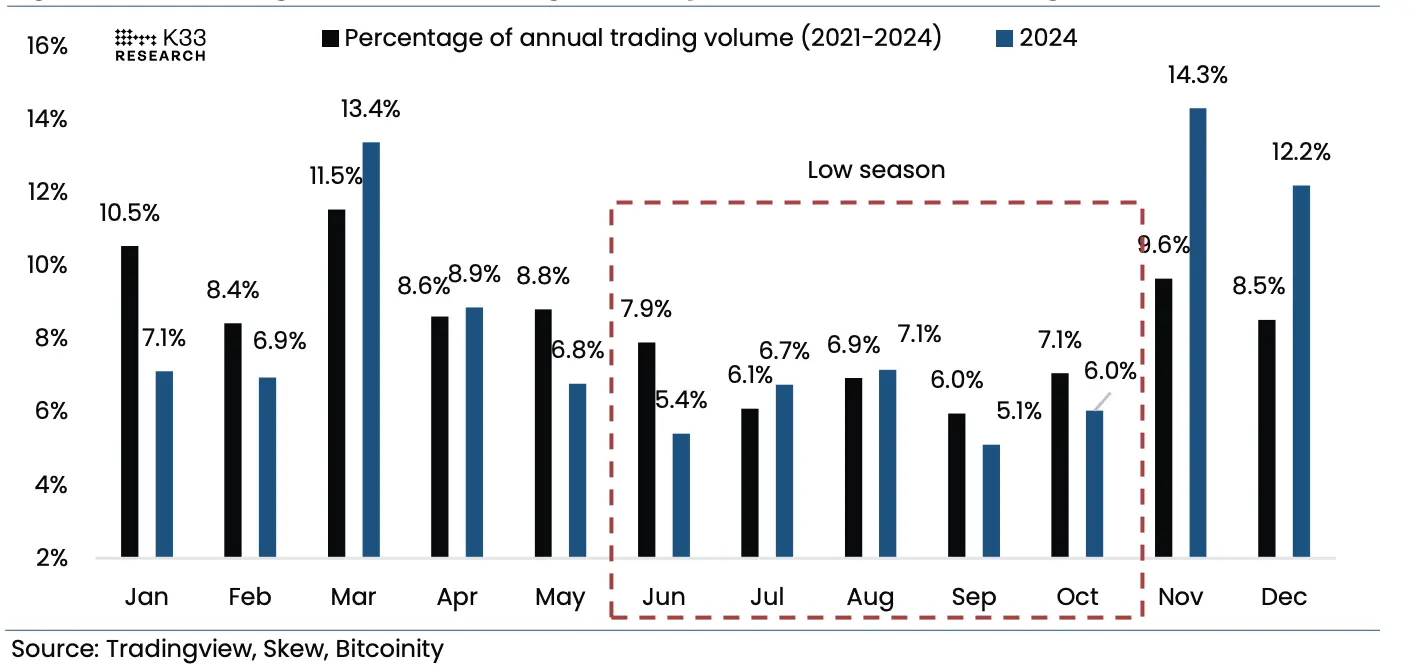
Figure 16: Percentage of Bitcoin transaction volume in each month from 2021 to 2024 (average + 2024 data)
However, despite the steady rise in Altcoin holdings, Altcoin funding rates paint a cautious picture of the market. When market sentiment was high in November/December last year, the average funding rate of the top five Altcoin by market capitalization (ETH, XRP, SOL, BNB, DOGE) was as high as 60%, 35 percentage points higher than the Bitcoin funding rate during the same period.
However, in the first half of 2025, its funding rate has been approaching or even lower than that of Bitcoin, showing a risk-averse sentiment. The coexistence of this steady growth in holdings and moderate funding rates indicates that the position strategy of the entire market is quite restrained.


