

Despite major upward news, XRP is experiencing strong downward pressure, falling nearly 5% in the last 24 hours and 8.5% over the past week. Several EMA death crosses formed in recent days, reflecting continued weakness.
Despite a $300 million investment from a Chinese AI company and VivoPower's $121 million funding announcement linked to Saudi Arabia, technical indicators suggest that sellers are currently firmly in control.
XRP Enters Oversold Territory
XRP's Relative Strength Index (RSI) has significantly dropped from 48.68 to 32.32 in the past day, indicating a sharp deterioration in short-term momentum.
This sharp decline reflects intensified selling pressure, pushing XRP closer to the oversold threshold.
Interestingly, XRP's RSI has not fallen below 30 since April 7th, suggesting that while the recent correction has been steep, it has not yet triggered the deep oversold conditions seen during severe market downturns.
The current value close to 30 indicates that XRP is approaching a potential exhaustion point in its decline. If buyers intervene, the price could stabilize or attempt a rebound.
This negative momentum occurred even after a Chinese AI company announced plans to invest up to $300 million in XRP and VivoPower, backed by the Saudi royal family, raised $121 million for the XRP Treasury.
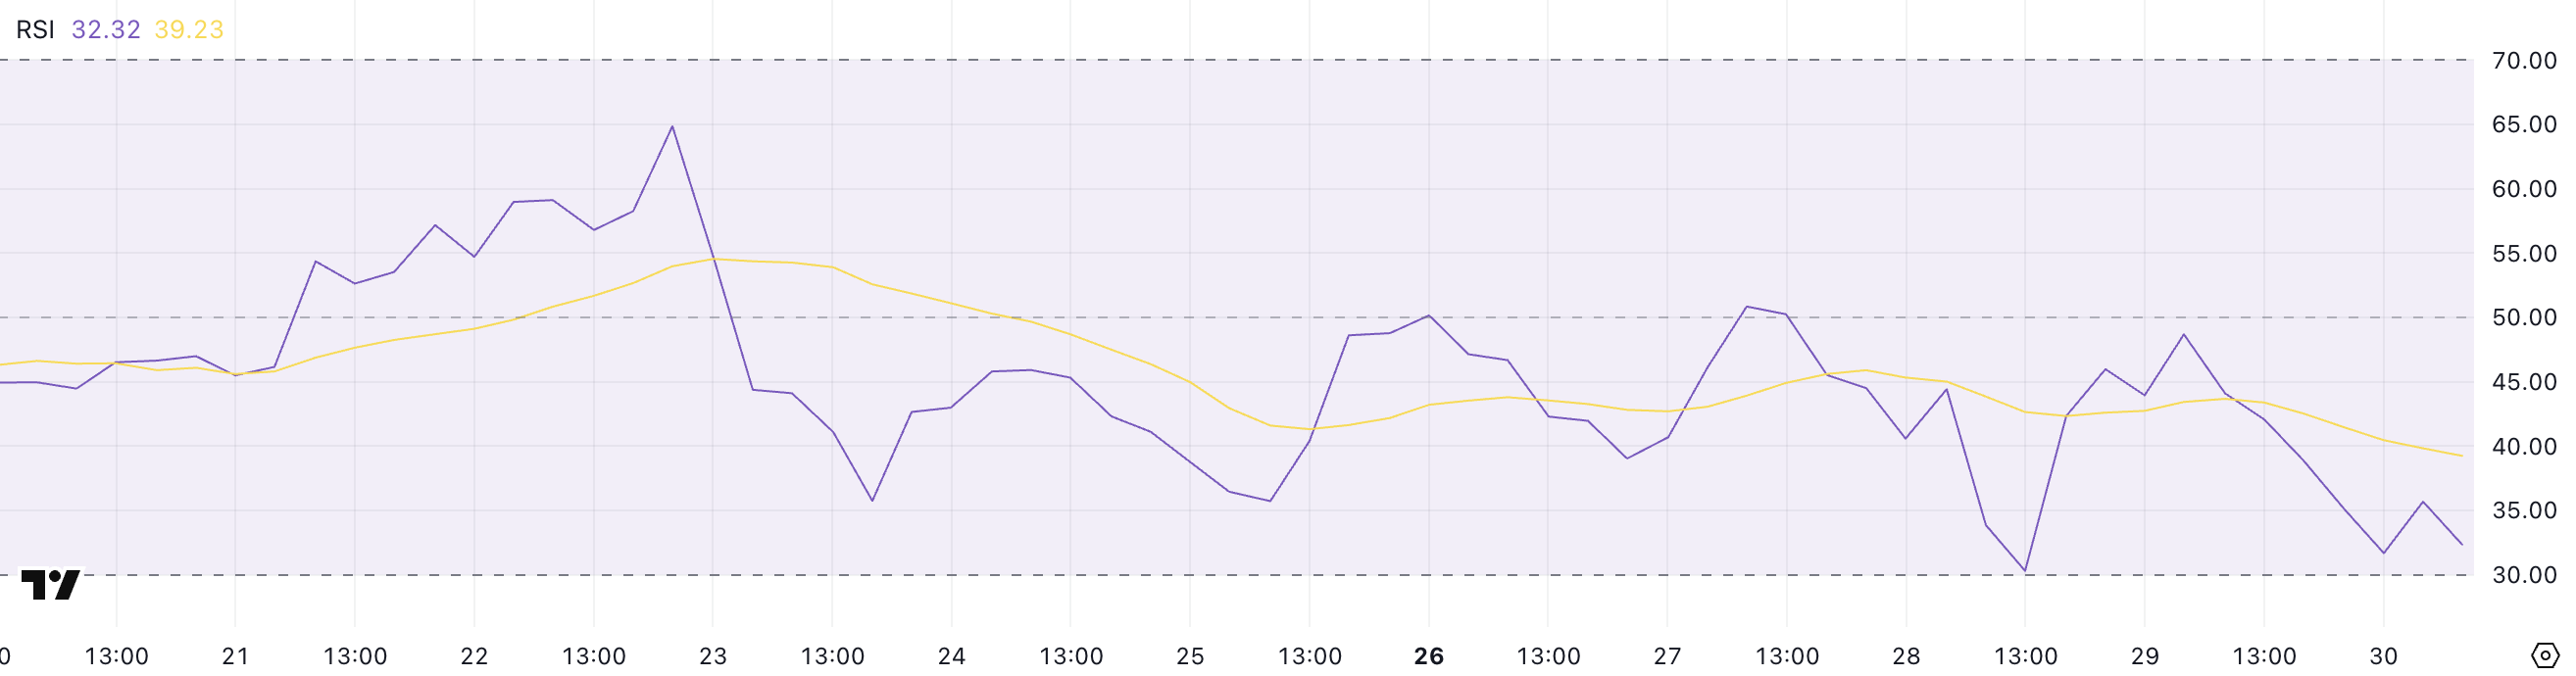
The RSI ranges from 0 to 100 and is a widely used momentum indicator designed to measure the speed and magnitude of price movements. Values above 70 typically indicate an overbought condition and potential price correction, while values below 30 signal an oversold condition and potential price recovery.
With XRP hovering just above the oversold threshold, the market stands at a crossroads. Further decline could push the RSI below 30, attracting technical traders' expectations of a rebound.
Simultaneously, stabilization at current levels could prevent deeper losses.
Considering XRP has not fallen below 30 for almost two months, a drop below that level could trigger new volatility. This might attract bottom buyers or accelerate the downward momentum if support levels are not maintained.
XRP DMI Signals Strong Downtrend... ADX Surges Above 34
XRP's Directional Movement Index (DMI) reveals significant changes in trend strength and momentum, with ADX rising from 27 to 34.78 in a day.
ADX, or Average Directional Index, measures trend strength without indicating direction. Values above 25 typically represent a strong trend, and above 30 indicate a very strong trend.
The sharp ADX increase confirms that the current trend is intensifying. However, the trend's direction is clarified by the directional indicator's movement: +DI has sharply dropped to 8.57, while -DI has surged to 32.
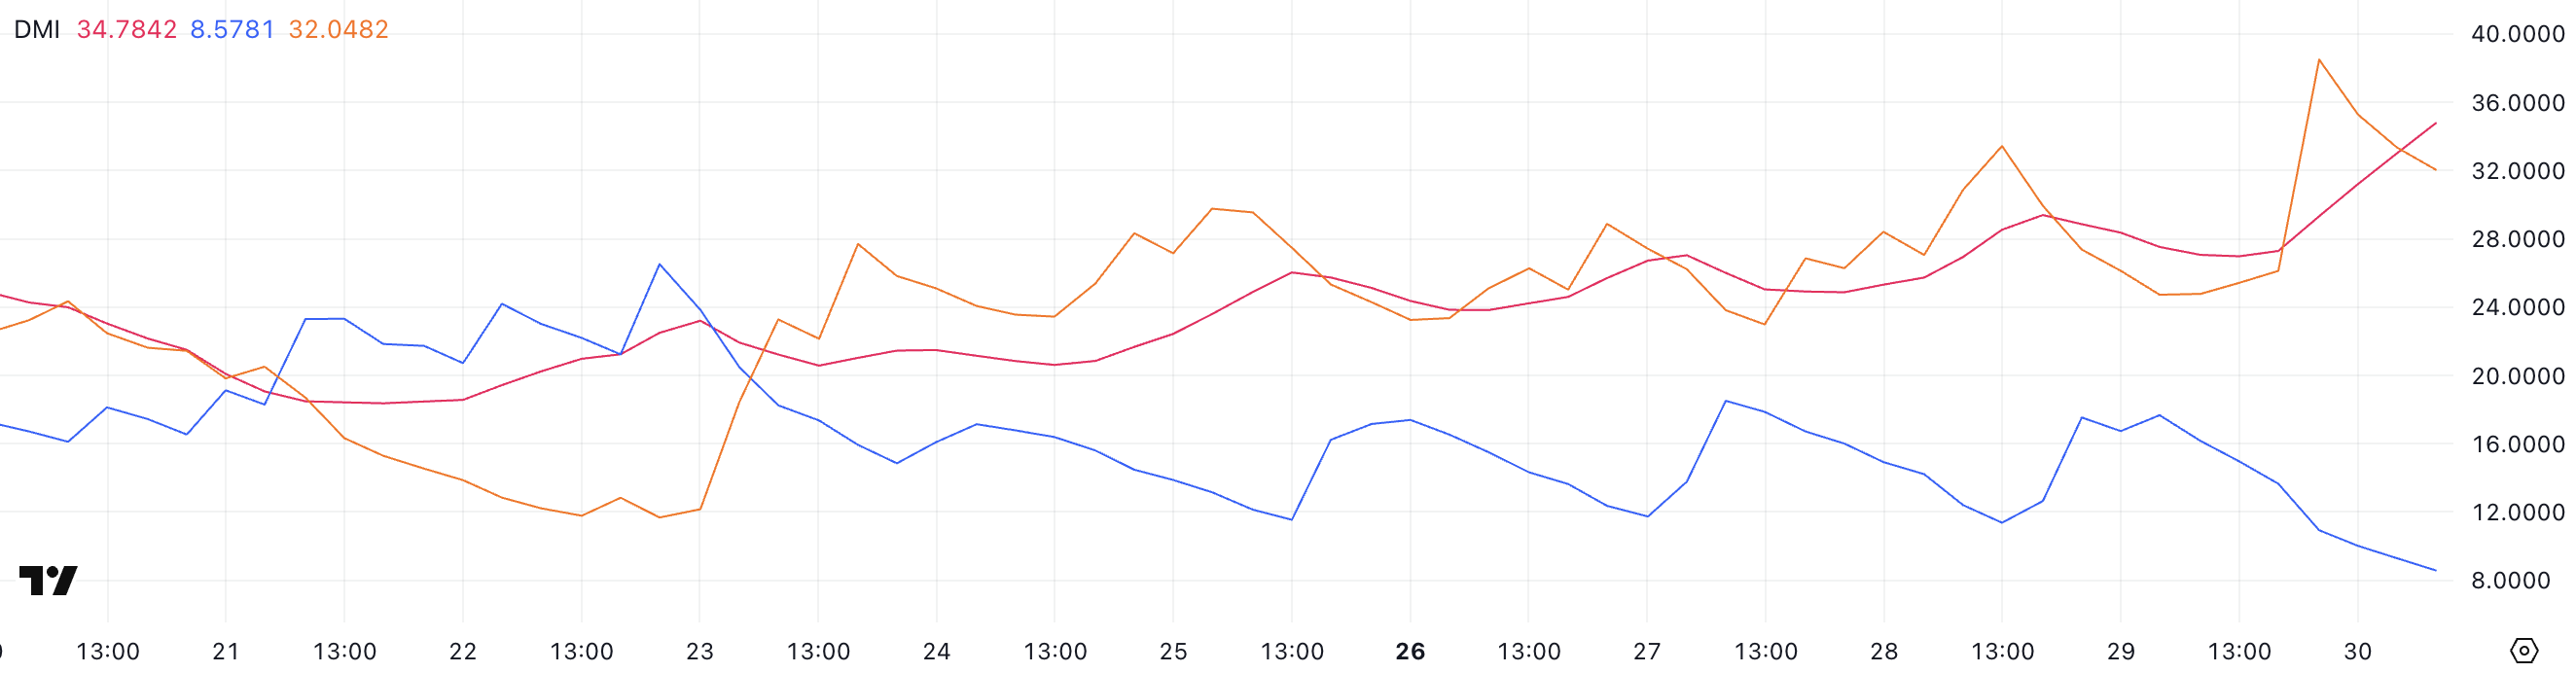
This gap between directional indicators emphasizes a strong downtrend. The +DI's decline indicates rapidly weakening upward momentum, while the -DI's rise shows accelerating selling pressure.
With -DI significantly higher than +DI and ADX confirming the movement's intensity, XRP appears firmly in a downtrend.
Unless buying interest suddenly reverses, the current setup points to continued downward pressure in the short term. This reinforces what other indicators like RSI have already signaled.
XRP at Risk of Falling Below $2
XRP's Exponential Moving Averages (EMAs) have shown multiple death crosses in recent days, reflecting persistent downward pressure on the token's efforts to recover above $2.50.
These downward crosses, where short-term EMAs fall below long-term EMAs, indicate weakened momentum and align with XRP's failure to re-enter recent upward territories.
If the correction intensifies, XRP might retest the $2.07 support line, and failing to maintain that could drop below $2 for the first time since April 8th. This could confirm broader market sentiment shifts and potentially accelerate downward momentum.

Still, if buyers regain control and XRP can reverse the trend, the outlook could change. In this case, $2.26 would emerge as a key resistance level. Successfully breaking through could signal new strength and draw attention to the next upward targets of $2.36, $2.47, and even $2.65.
These resistance levels would need to be breached with convincing volume to invalidate the current weak moving average structure.
Until then, multiple death crosses warn that downward pressure remains dominant unless a strong recovery occurs.


