

Pi Network (PI) is experiencing increasing technical weakness, falling nearly 15% over the past 7 days and 4.4% in the last 24 hours, with its market capitalization currently at $512 million. Trading volume increased by 25% in the past day, reaching $104.6 million, indicating increased activity amid deepening decline.
Key indicators such as ADX, CMF, and EMA structure all suggest increasing bearish momentum, with selling pressure intensifying and price movement struggling to maintain support. Unless momentum shifts, PI appears vulnerable to further short-term decline.
Pi Network Decline Intensifies
Pi Network (PI)'s Directional Movement Index (DMI) chart shows the Average Directional Index (ADX) rising from 11.46 to 21 the previous day.
ADX measures trend strength regardless of direction. Generally, ADX below 20 indicates a weak or non-trending market, while 20 or above suggests the trend is beginning to strengthen.
With PI's ADX crossing this threshold, the data suggests a more decisive bullish or bearish movement is developing.
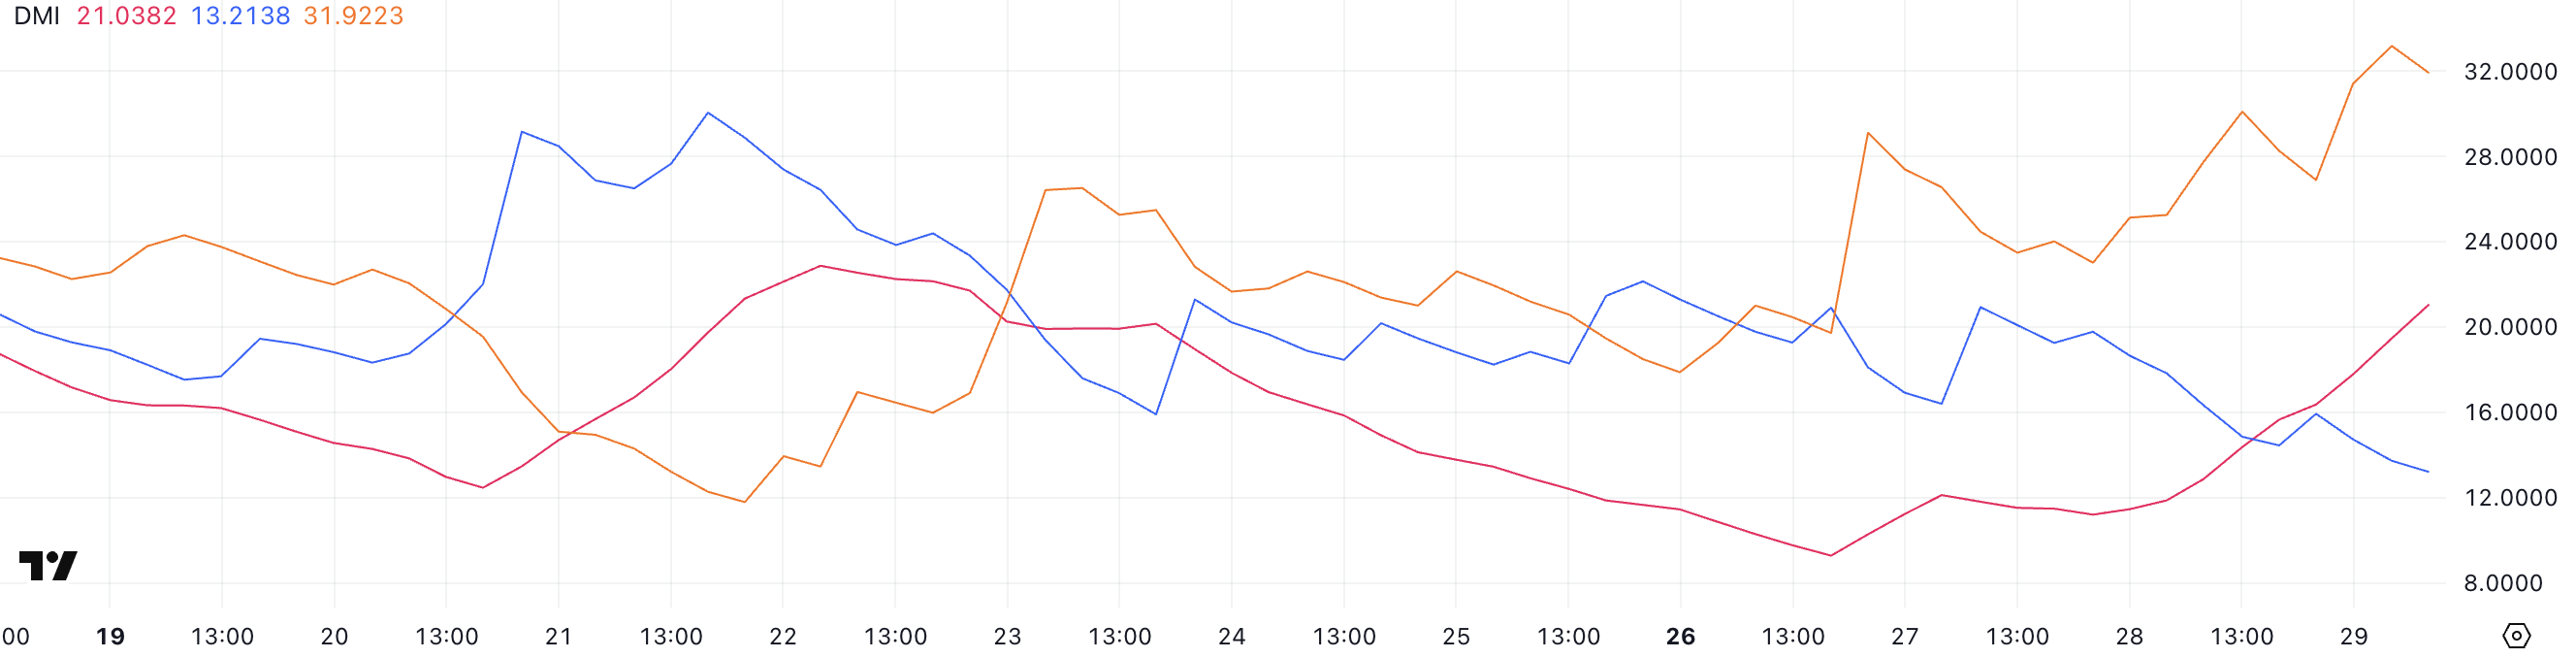
Digging deeper, +DI (Positive Directional Indicator) dropped from 20.93 to 13.21 two days ago, while -DI (Negative Directional Indicator) surged from 23.48 to 31.92.
This widening gap clearly shows -DI's dominance, indicating increasing downward pressure on PI. When -DI exceeds +DI and ADX strengthens, it typically confirms a bearish trend gaining momentum.
In summary, indicators suggest PI may enter a stronger downtrend, and traders should carefully monitor subsequent price movements.
Metrics Indicate Strong Selling Pressure
Pi Network (PI)'s Chaikin Money Flow (CMF) dramatically dropped from 0.08 three days ago to -0.08 the previous day, and currently stands at -0.20.
CMF is a volume-weighted indicator measuring capital inflows and outflows for an asset, typically measured over 20 or 21 days.
Values above 0 typically indicate buying pressure and accumulation, while values below 0 suggest selling pressure and distribution. CMF exceeding ±0.10 is usually considered significant, with deeper negative values indicating continuous capital outflow.
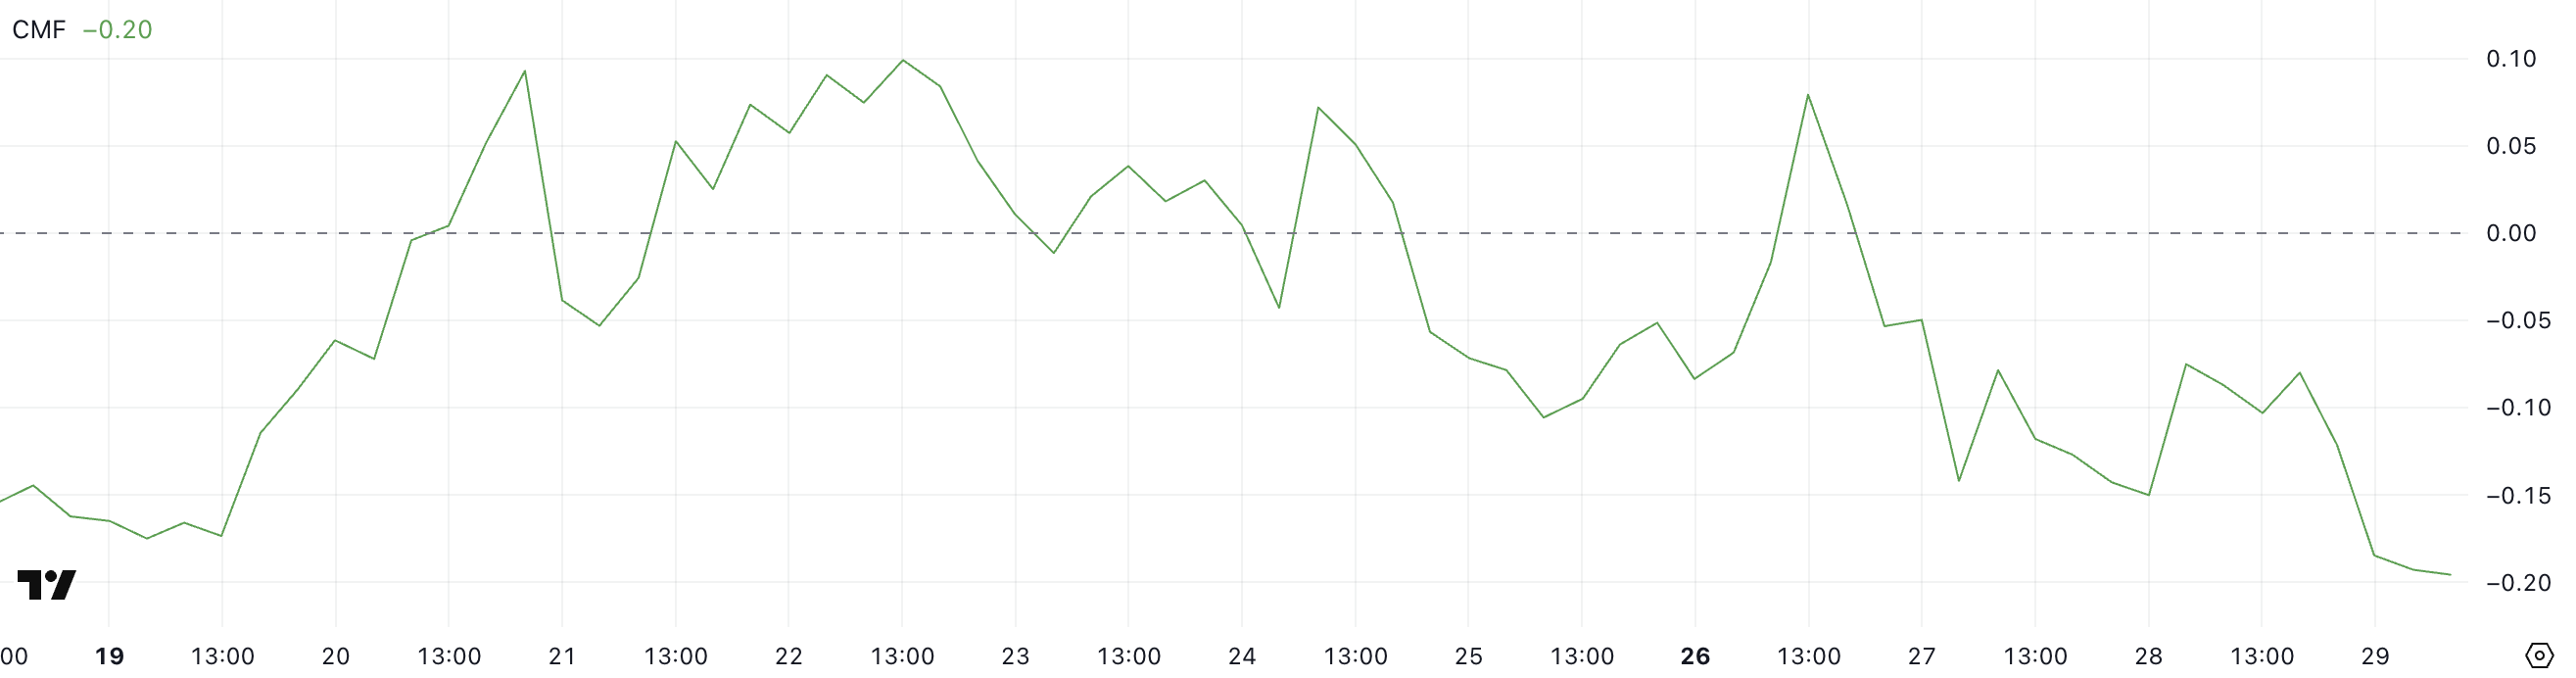
PI's CMF at -0.20, its lowest since May 17, strongly suggests sellers are in control.
This sharp decline reflects increasing capital exodus from the asset, which, combined with recent price weakness, reinforces the bearish outlook.
Continued CMF decline or maintenance of deep negative levels could indicate that rebound attempts might face strong resistance due to lack of buying volume support.
PI Price, Watching Lower Support Levels
PI's Exponential Moving Average (EMA) indicator remains bearish, with short-term EMA positioned below long-term EMA, clearly indicating ongoing downward momentum.
The increasing distance between these EMA lines reinforces the current decline's strength. If PI continues falling, the next support level is $0.66, and losing this could open possibilities for further decline to $0.57.
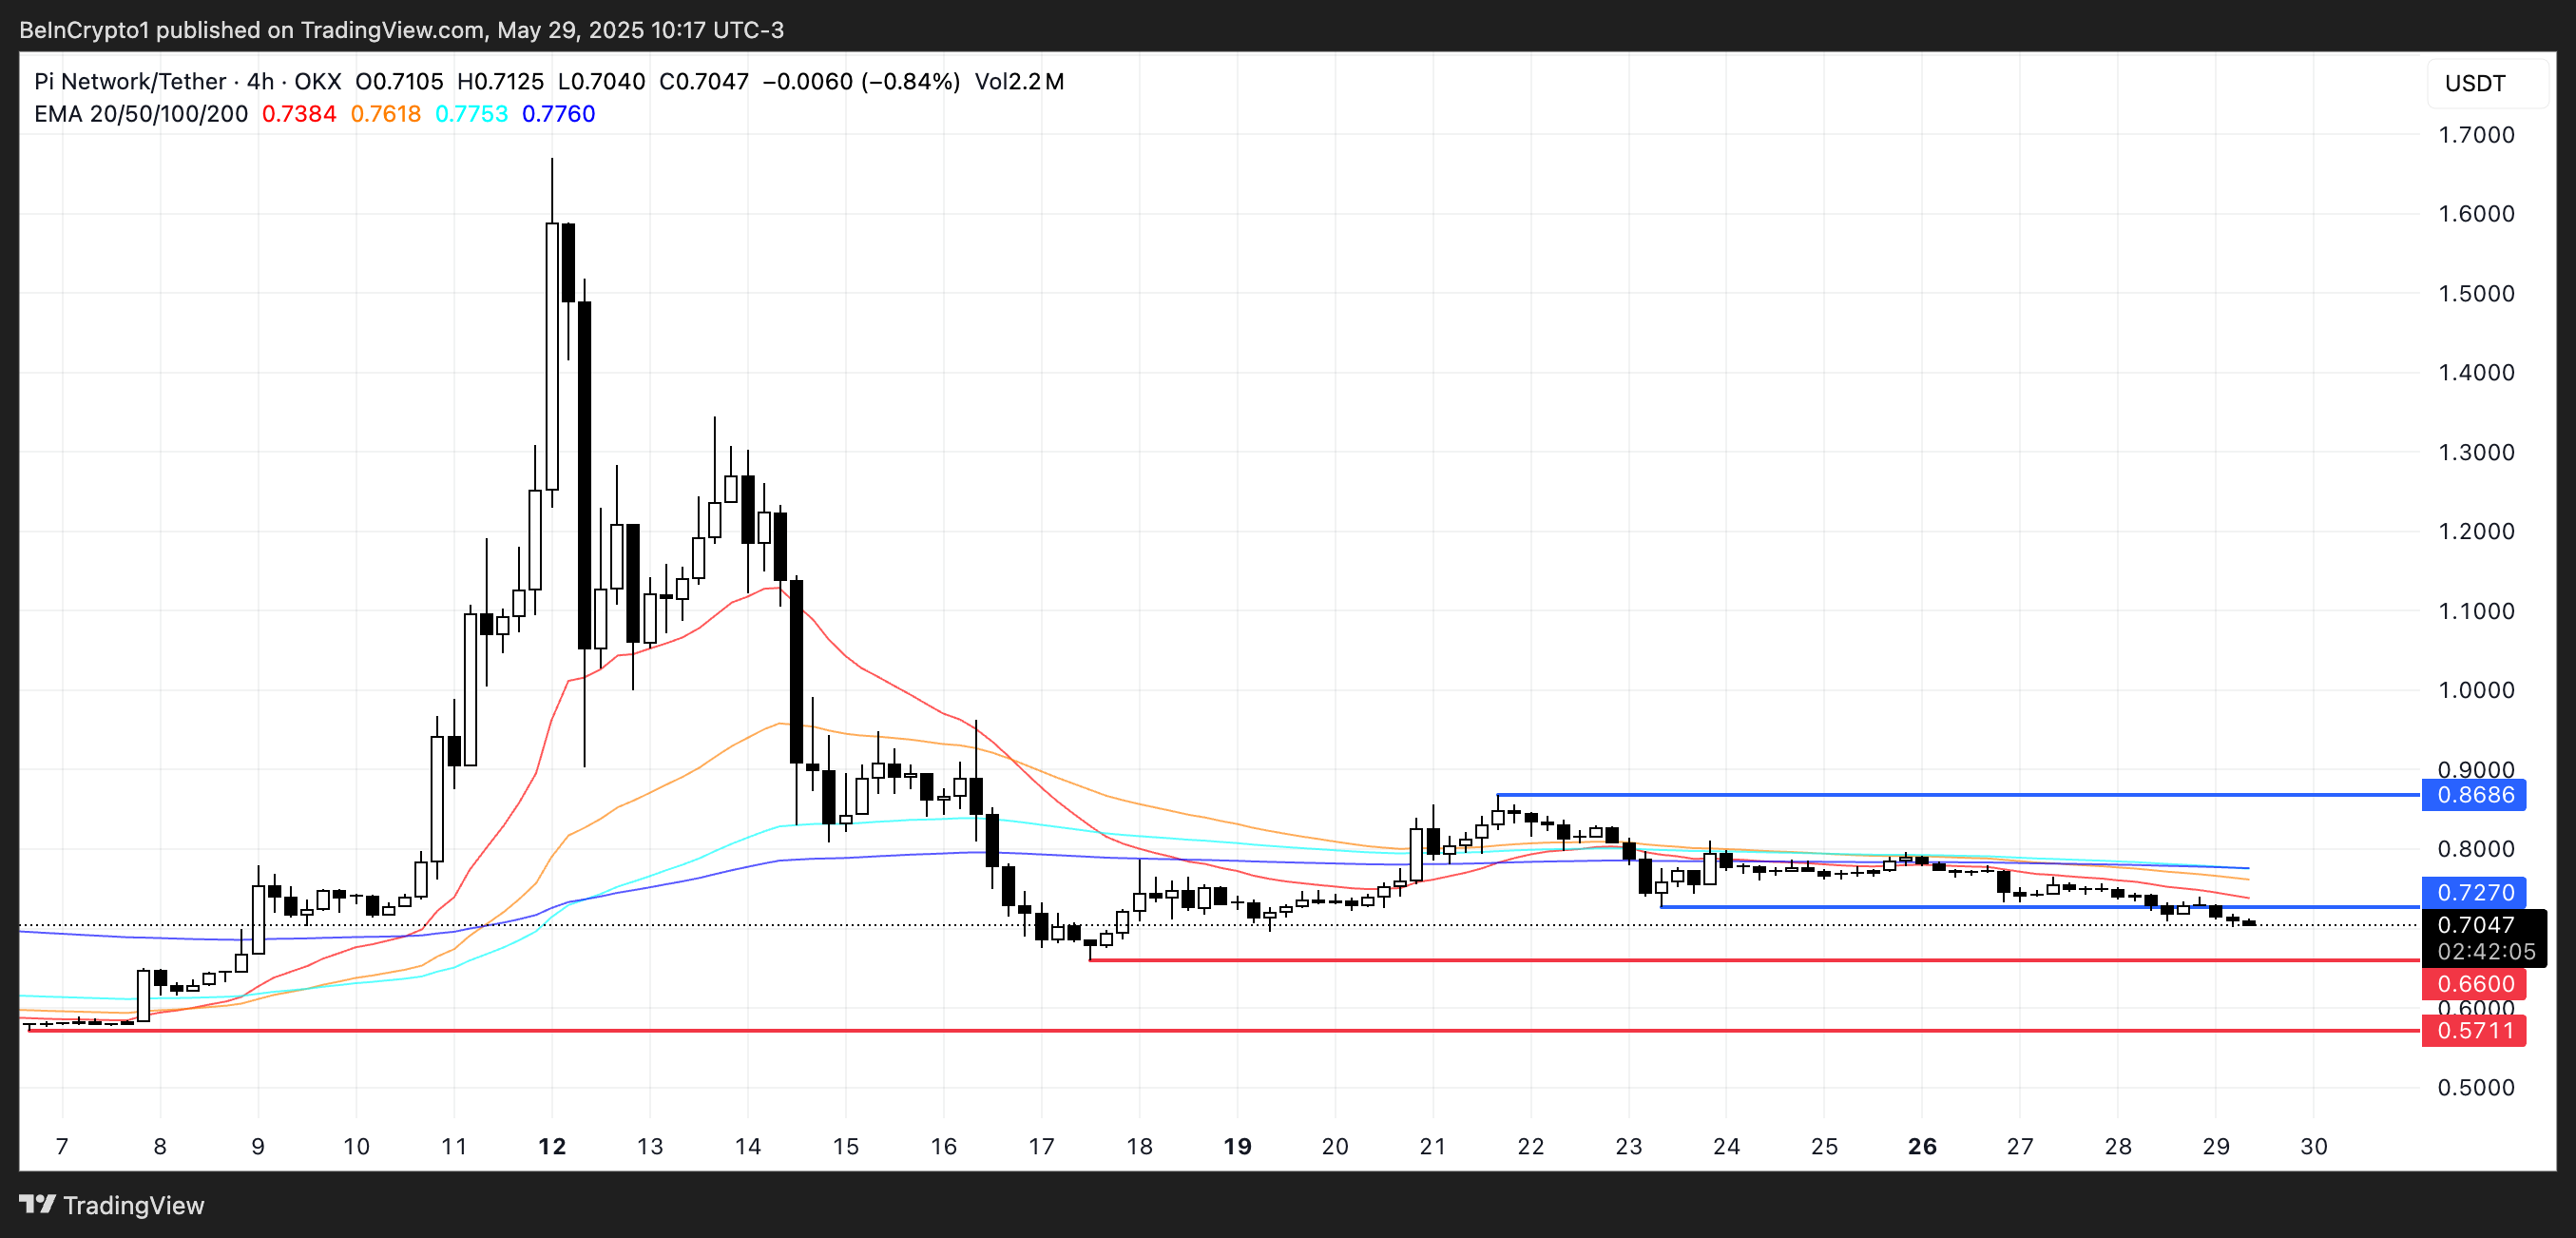
Conversely, if PI can reverse the current downtrend, the first major resistance to watch is $0.727. Breaking this could signal a short-term recovery and potentially push the price to $0.86.
However, until short-term EMA flattens or crosses above long-term EMA, any bullish attempts may remain vulnerable to selling pressure.


