

Ethereum (ETH) briefly exceeded $2,000 after the recent FOMC meeting, but is still struggling below that level. The upward momentum has quickly disappeared, and ETH is showing weakness again.
Technical indicators, including RSI and DMI, indicate an increase in short-term bearish pressure. Traders are watching key support and resistance levels to determine whether ETH will continue to adjust or attempt a recovery.
Ethereum RSI Drops After Overbought Level
Ethereum's RSI has sharply dropped from 71 to 46.63 two days ago, signaling a change in momentum.
The Relative Strength Index (RSI) is a momentum measurement indicator that measures the speed and change of price movements, typically ranging from 0 to 100. Levels above 70 indicate an overbought asset, while levels below 30 may suggest an oversold condition.
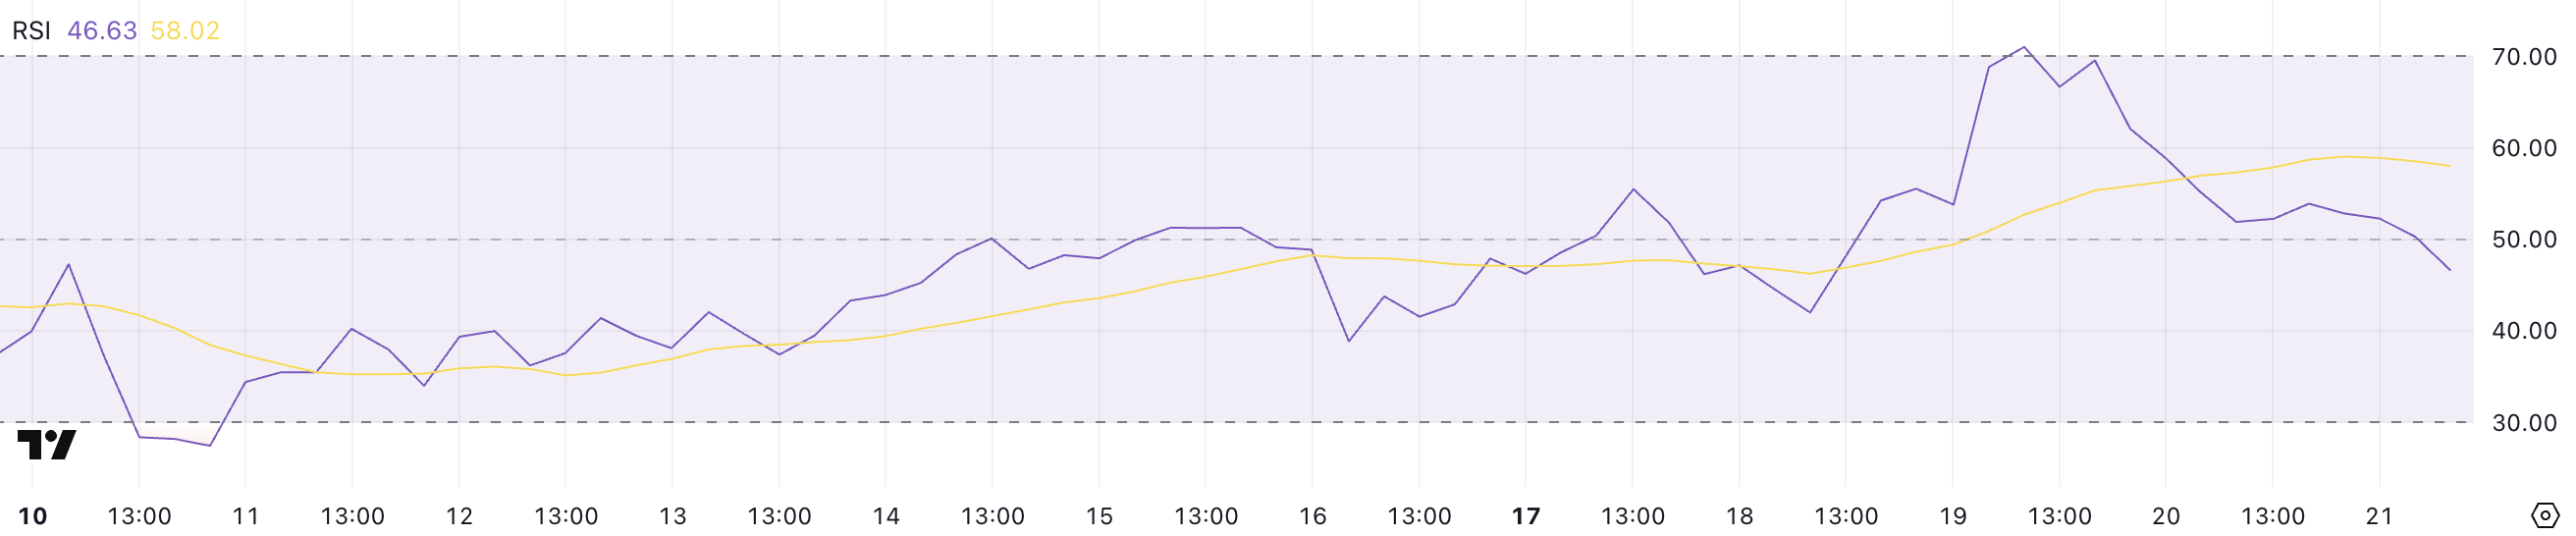
ETH's RSI is currently at 46, entering the neutral zone and showing that recent upward momentum has disappeared. This may indicate a period of consolidation or additional downside risk if sellers maintain control.
Traders now expect ETH to stabilize and rebound if demand returns, or continue to adjust if bearish pressure intensifies.
ETH DMI, Selling Pressure Prevails
Ethereum's DMI chart shows that ADX dropped from 24.5 to 17.96 yesterday, indicating weakening trend strength.
The Average Directional Index (ADX) measures trend strength, with values above 25 indicating a strong trend and values below 20 suggesting a weak or ranging market.
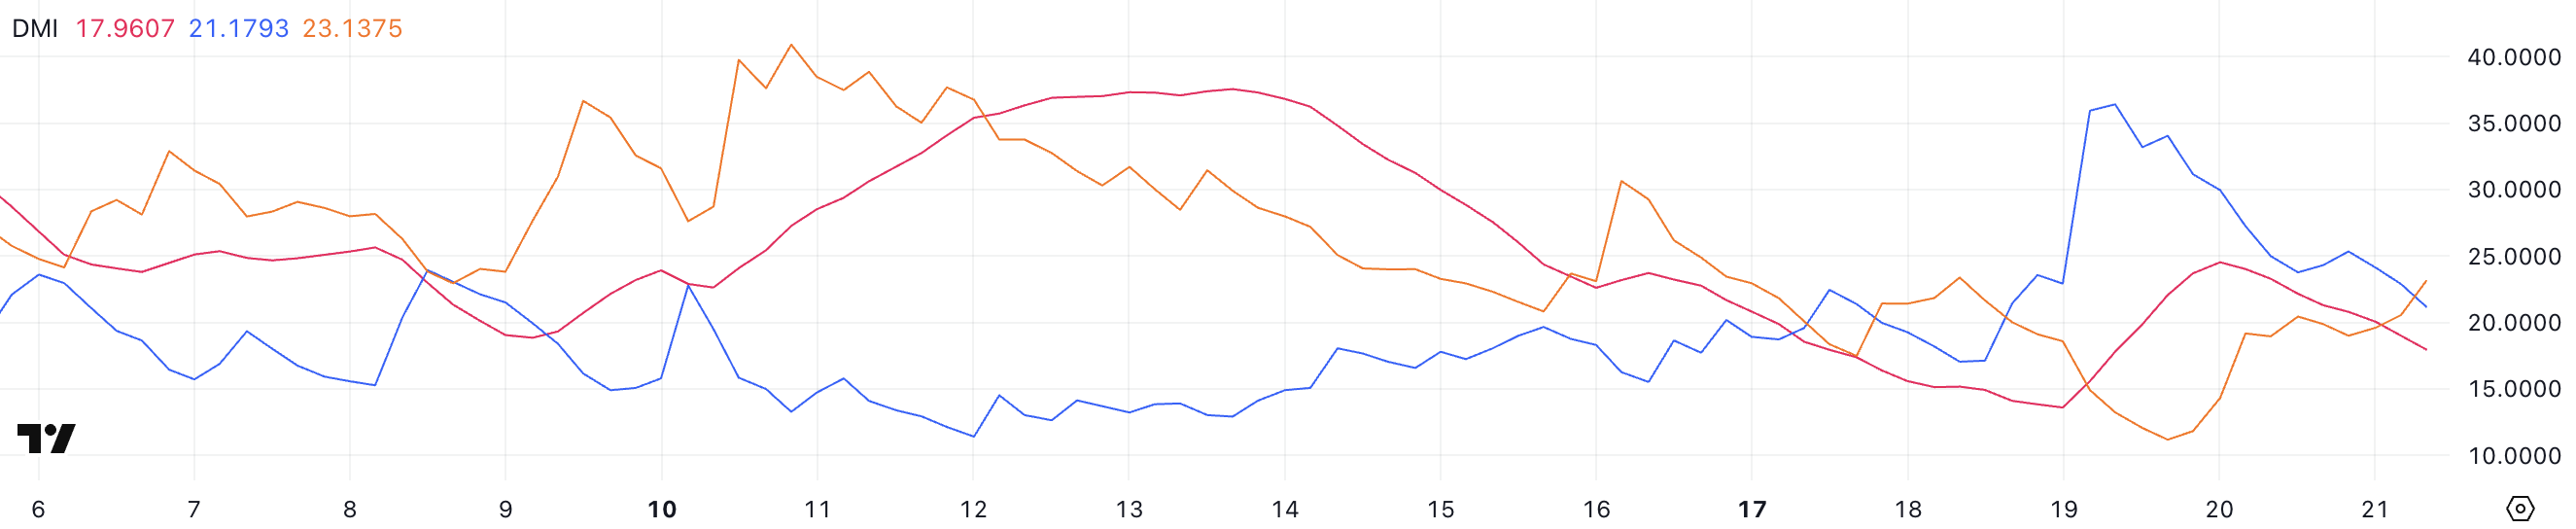
Simultaneously, ETH's +DI has dropped from 34 to 21.17, signaling disappearing upward momentum. Meanwhile, -DI has risen from 11.17 to 23.12, indicating increasing bearish pressure.
With ADX declining and -DI surpassing +DI, Ethereum may face further decline or enter a correction with sellers exerting more influence on price action.
Can Ethereum Surge 30%?
Ethereum's price is currently in a correction phase and may test key support levels at $1,867 and $1,823 if this trend continues.
Falling below this area could open up a deeper decline to $1,759, with a risk of ETH dropping below $1,700 for the first time since October 2023.
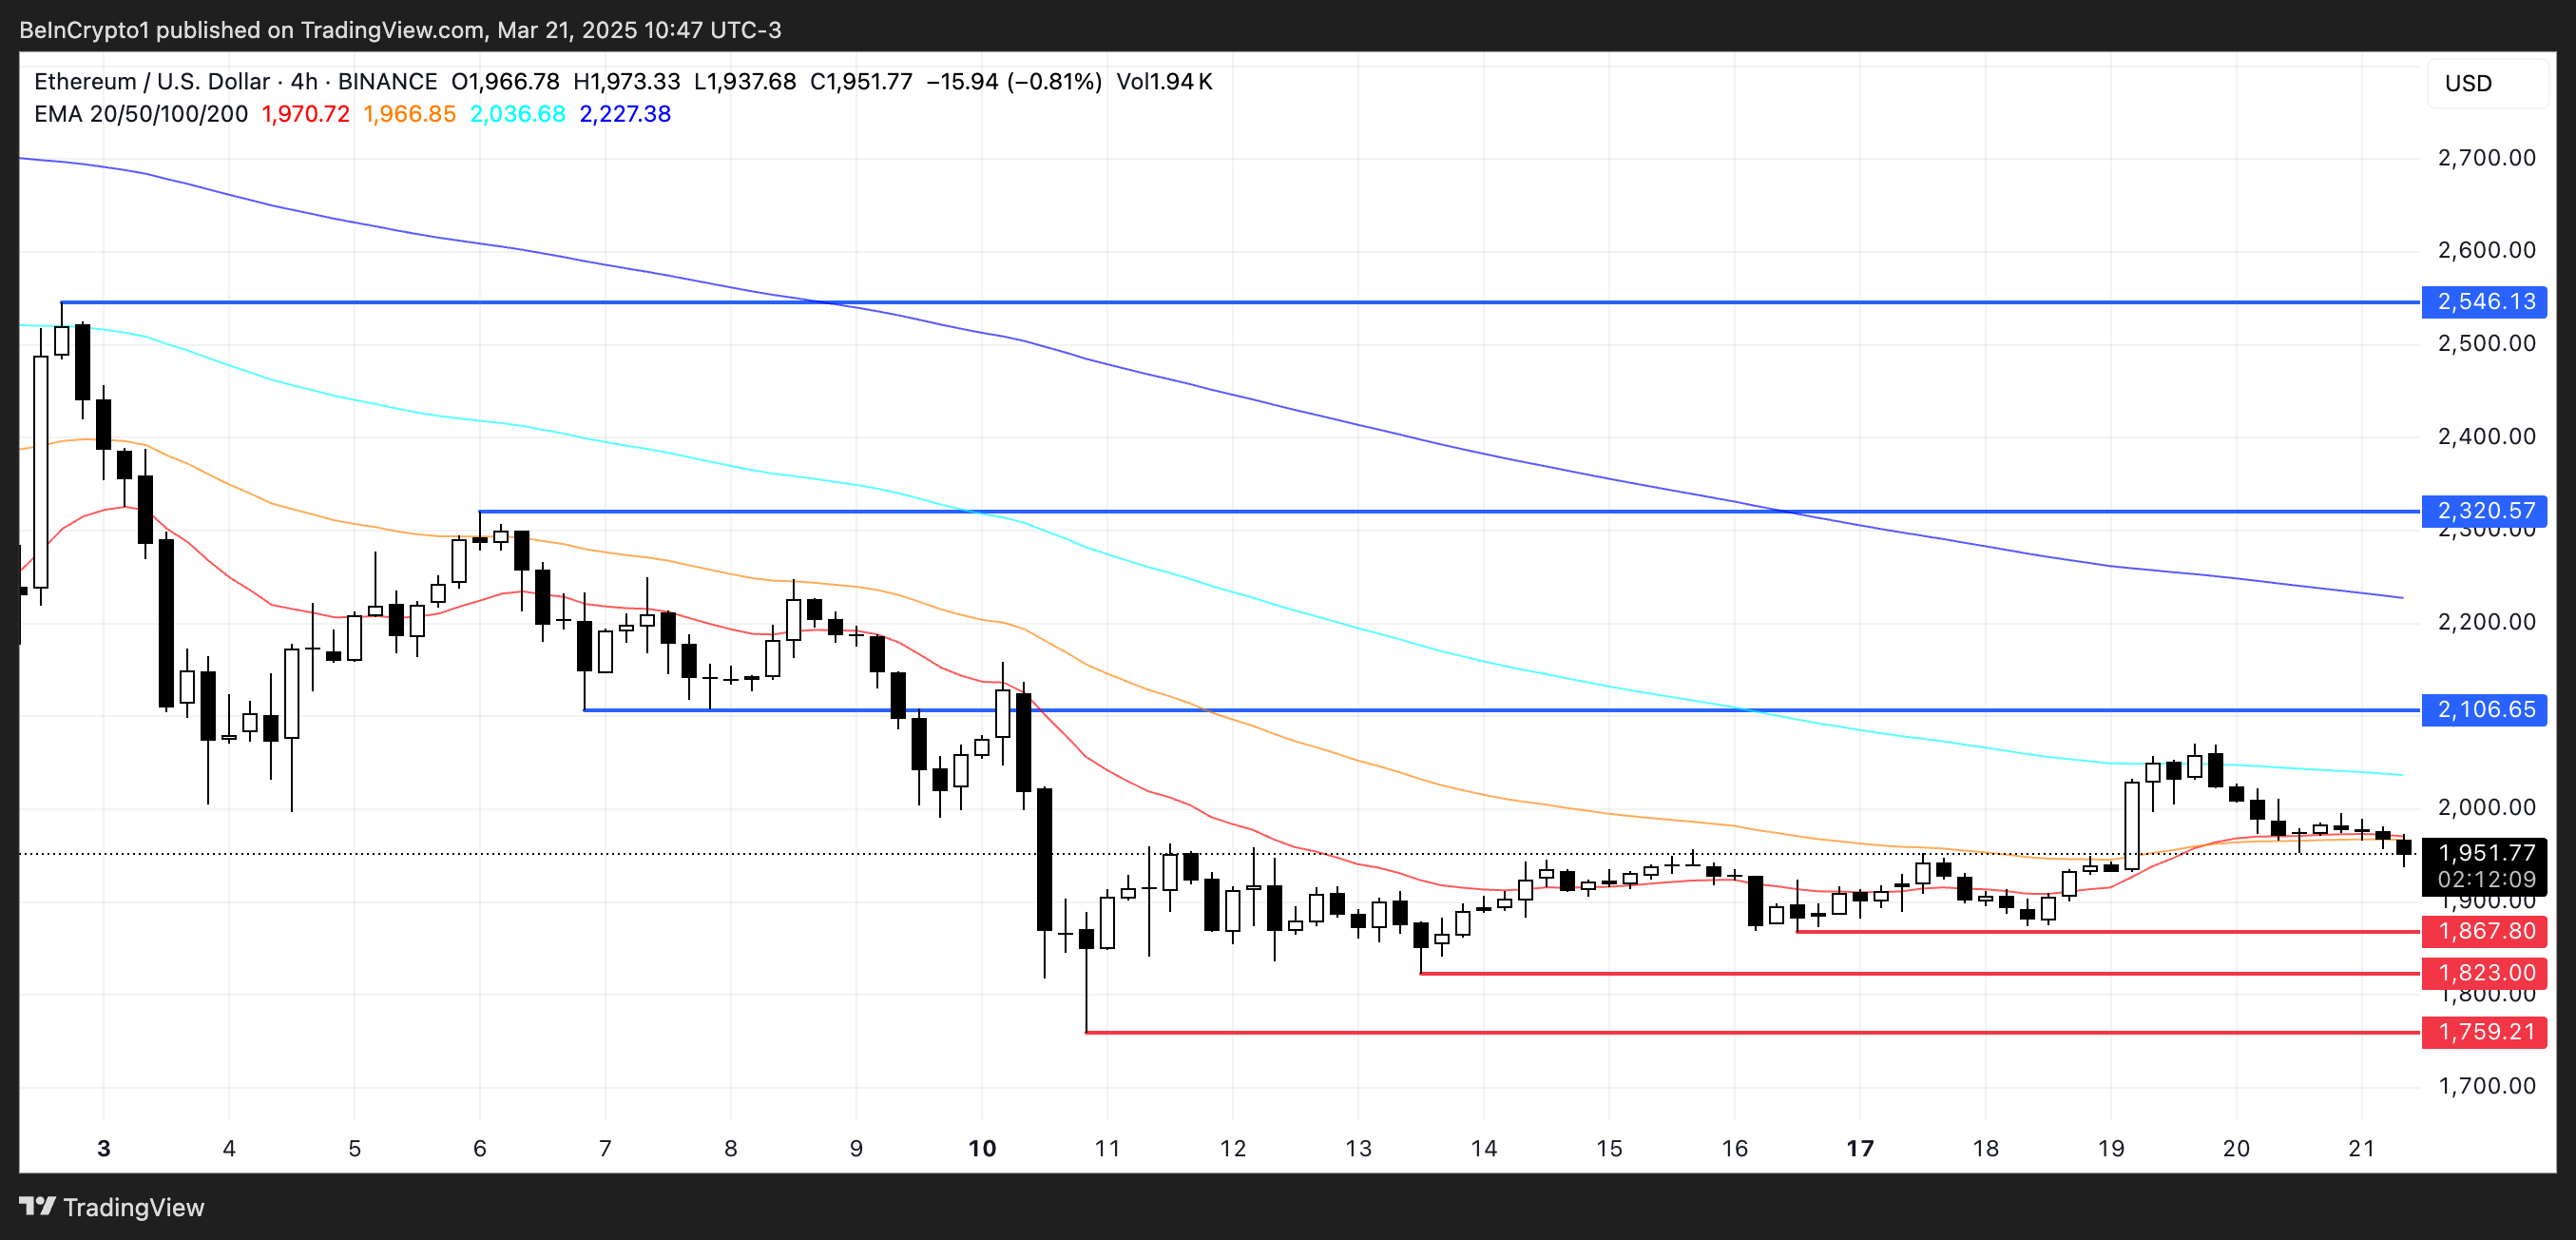
However, if Ethereum reverses its current downtrend and recovers upward momentum, it could move towards the $2,106 resistance.
A stronger rally could target $2,320 and even $2,546, potentially providing around a 30% upside from current levels.


