

ETH has faced significant challenges this month. Over the past 20 days, it has lost 10% of its value and is currently trading at $2,021.
This price decline has shaken investor confidence, and there has been persistent capital outflow from physical ETH exchange-traded funds (ETFs) since early March.
Decreased ETH Investor Confidence...Outflows from Spot ETFs
According to on-chain data from SosoValue, physical ETH ETFs have recorded 11 consecutive days of outflows, with total withdrawals exceeding $370 million.
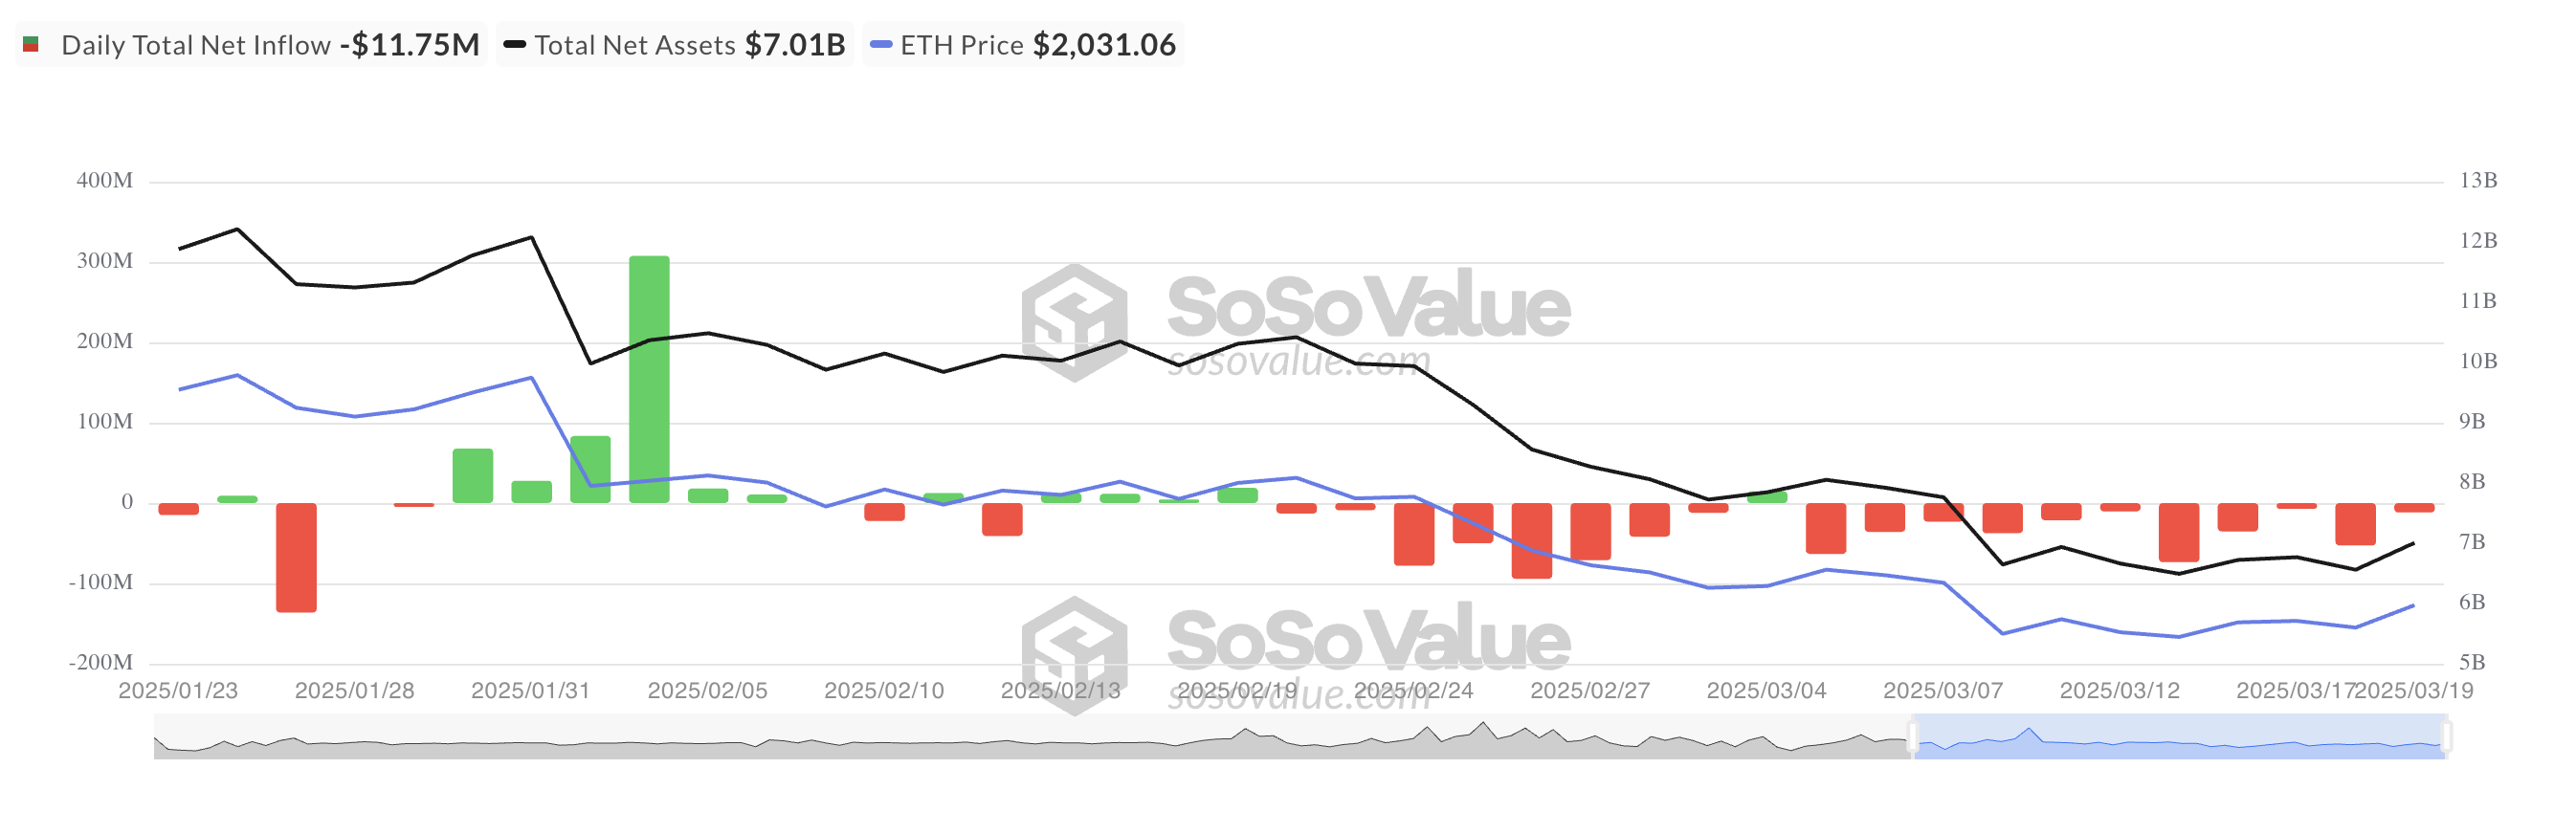
Investor sentiment remains overwhelmingly bearish, with only a single day of inflows recorded this month. The total net asset value of all U.S. physical ETFs is currently $7.01 billion, down 44% from the beginning of the year.
When physical ETH ETFs experience net outflows, investors are withdrawing more funds than they contributed, reflecting a decrease in confidence in the coin's price performance. Persistent outflows indicate a bearish sentiment among investors and can strengthen the selling pressure on ETH prices.
Additionally, the decrease in the coin's open interest (OI) reflects a reduction in demand. At the time of reporting, this stood at $6.58 billion, a 20% decrease compared to the previous month.
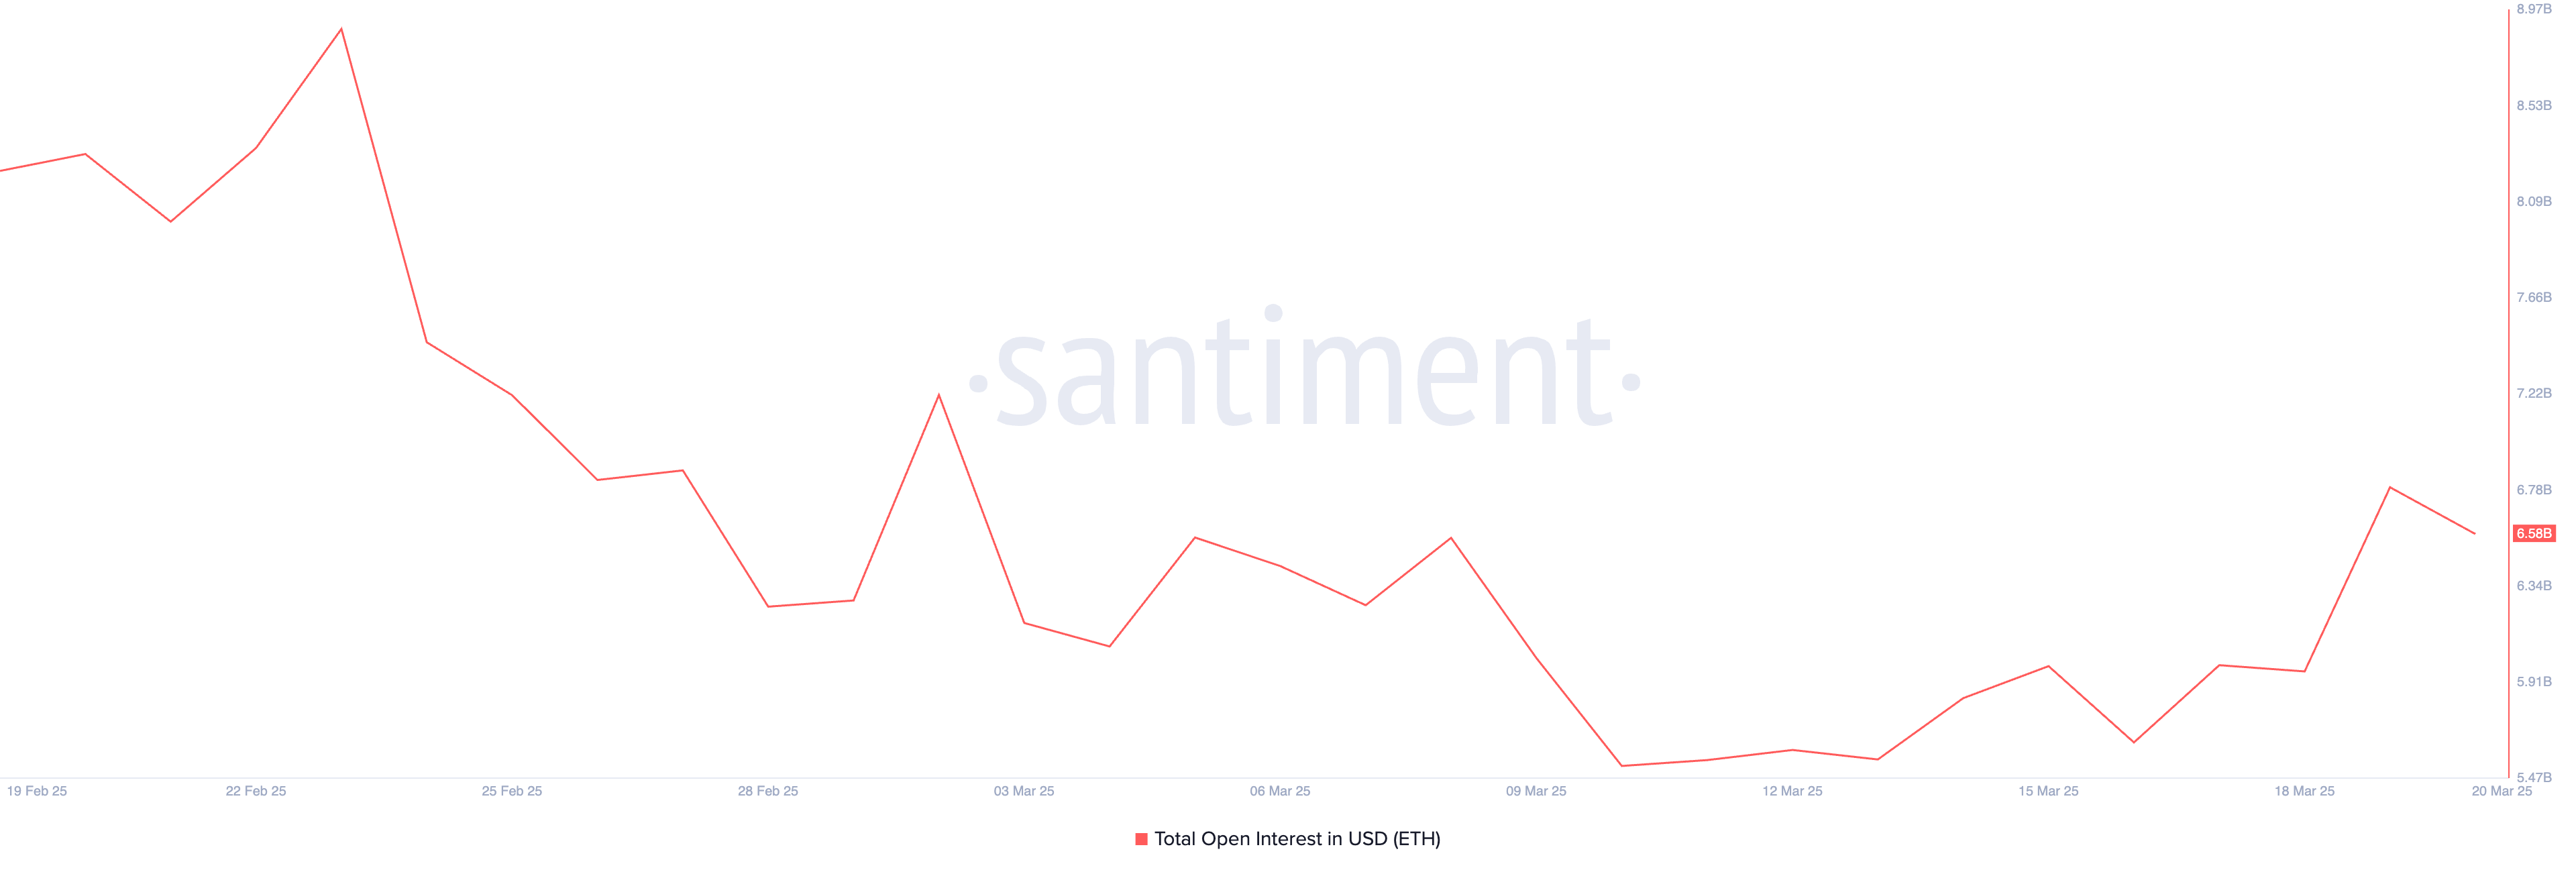
The open interest of an asset measures the total number of outstanding futures and options contracts. A decrease indicates that traders are closing positions rather than opening new ones.
This suggests a decline in market participation and weakened momentum for ETH. This points to uncertainty and lack of conviction regarding the price direction of major altcoins, contributing to the downtrend.
ETH Sees MACD Golden Cross Buy Pressure...Expects Recovery
Amid the market recovery last week, ETH's Moving Average Convergence Divergence (MACD) formed a golden cross. On the daily chart, the MACD line (blue) crossed above the signal line (orange), indicating that buy pressure is gaining momentum.
The MACD indicator measures the strength and direction of an asset's momentum. It helps traders identify potential trend reversals and momentum changes. The appearance of a golden cross suggests that the upward momentum is increasing, often interpreted as a buy signal by traders.
With strengthening buy pressure, ETH could reverse its current downtrend and rise to $2,224.
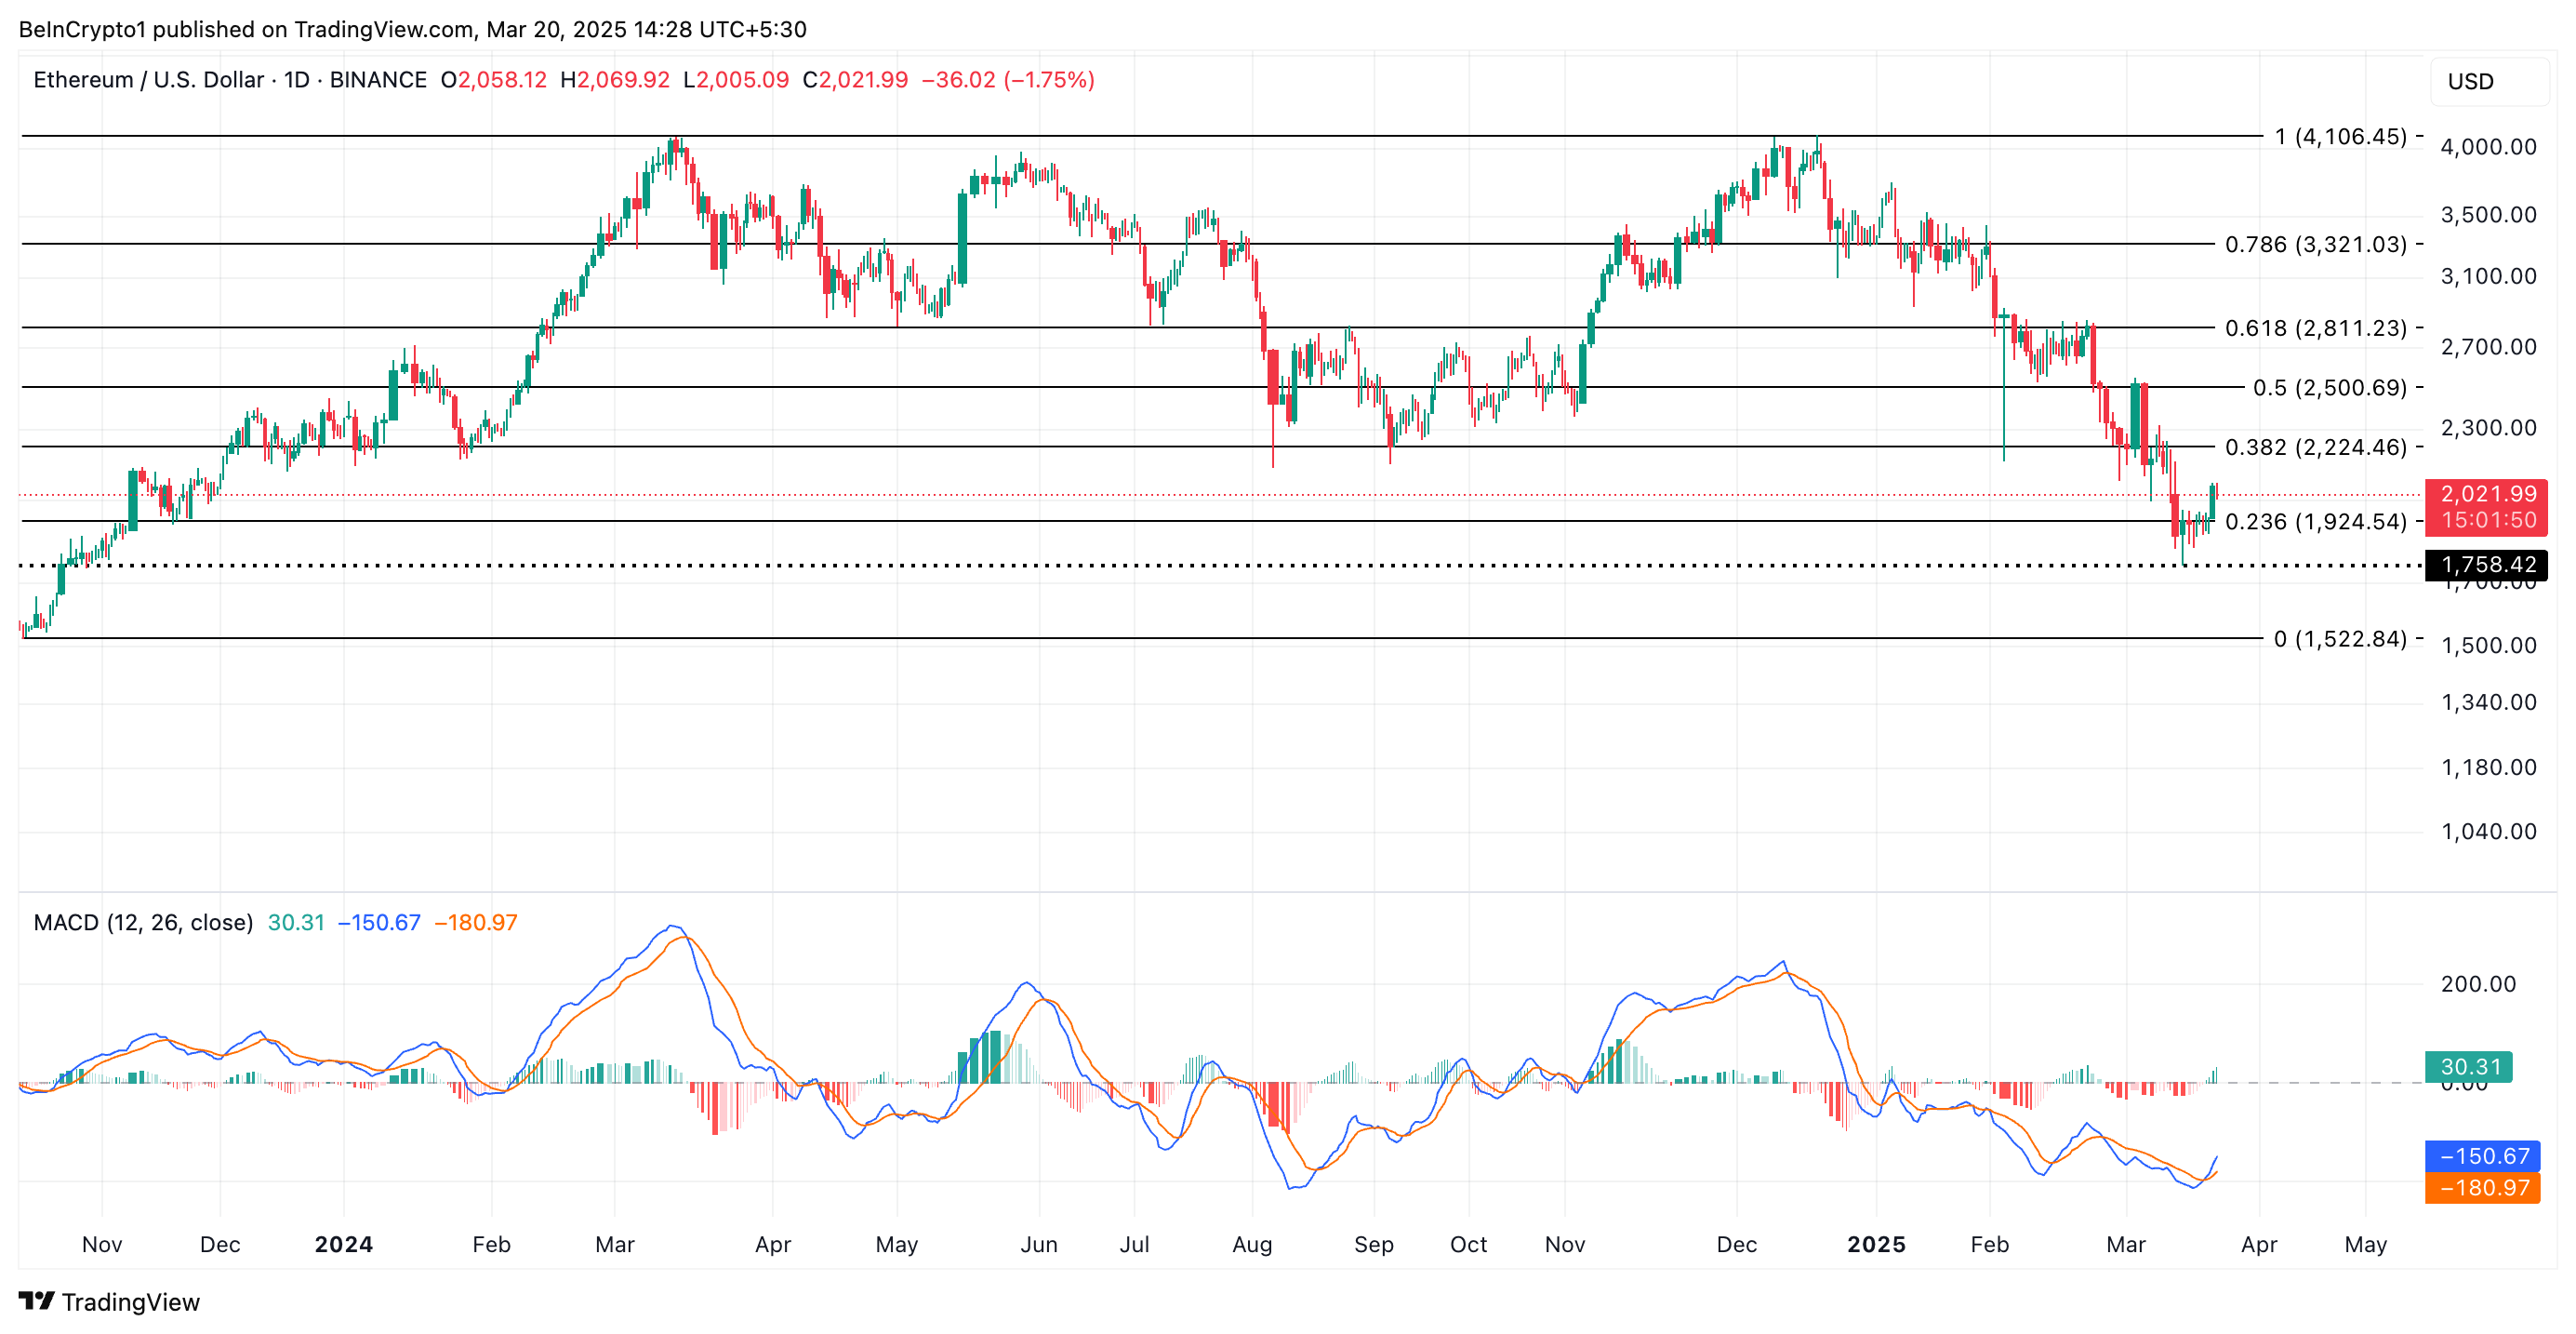
Conversely, if the price decline persists, ETH could fall below $2,000 and trade at $1,924.


