

Hedera (HBAR) has been trading below $0.20 over the past week. Due to the continuous downward trend, the token is under pressure, and both technical indicators and price movements suggest a cautious market environment.
Recent signals from DMI and the Ichimoku Cloud emphasize that sellers are increasingly gaining the upper hand, and bearish sentiment is growing. The question now is whether HBAR can maintain its footing above a critical support level or if further decline is expected.
Hedera DMI, Buyers Still Leading... Sellers Increasing
Hedera's ADX is currently at 16.15, up from 11.5 yesterday. This morning, it briefly reached 17.16. While this is a slight increase, it indicates that the trend is slowly gaining momentum.
Along with this, the +DI line tracking buying pressure has decreased from 26.95 yesterday to 20.27, suggesting that buying strength is weakening.
In contrast, the -DI line representing selling pressure has increased from 13.97 to 16.65, indicating that sellers are becoming more active.
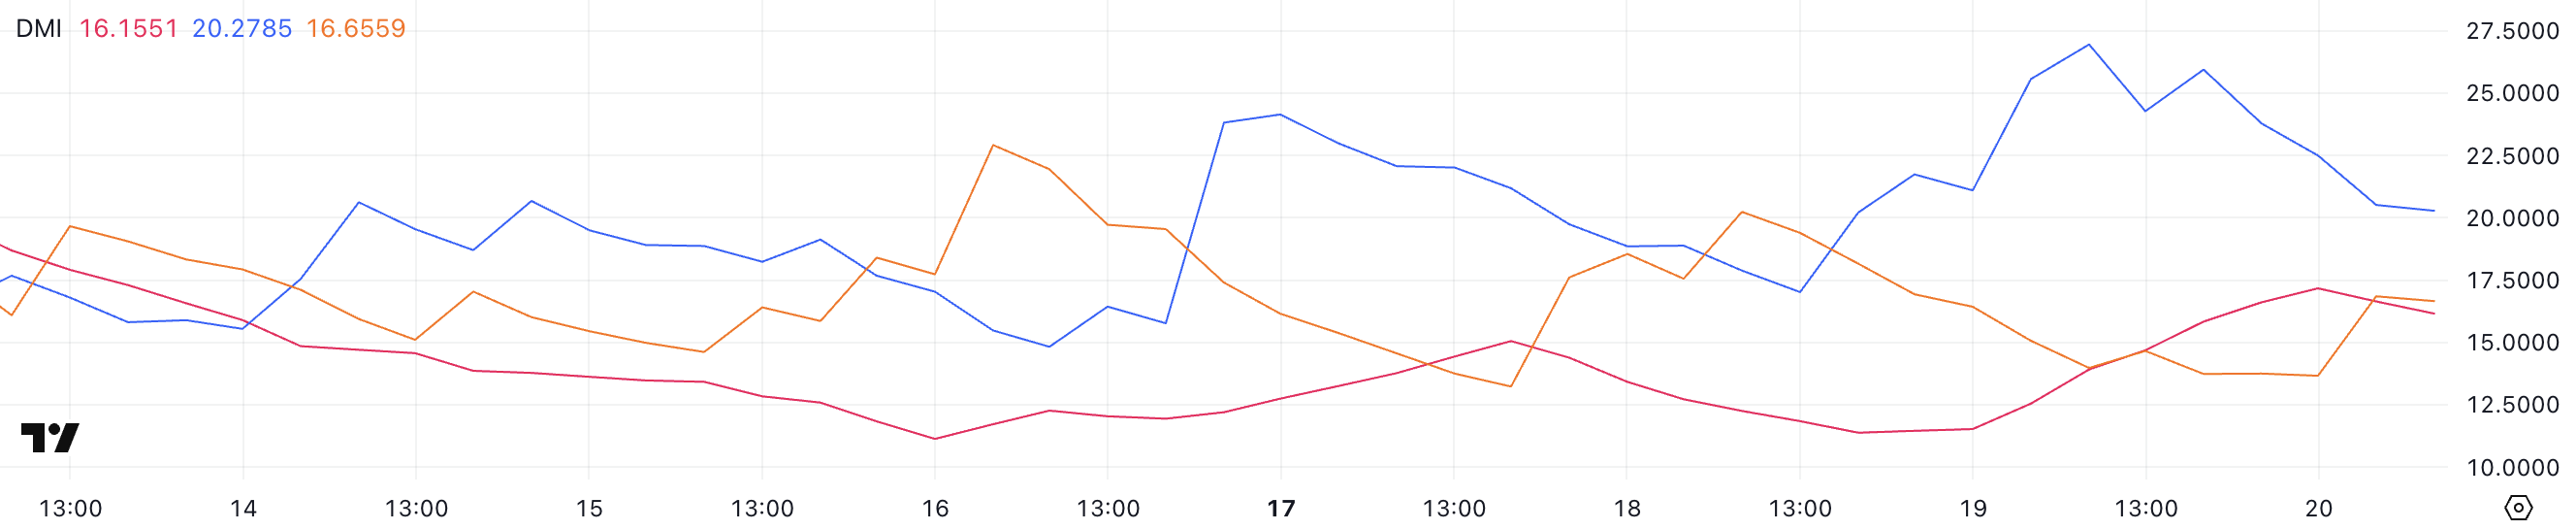
ADX (Average Directional Index) measures the strength of a trend. Generally, an ADX below 20 indicates a weak or non-existent trend, between 20 and 40 suggests a developing or moderate trend, and above 40 indicates a strong trend.
Since Hedera's ADX is still below 20, the trend is weak, but the recent increase could imply a potential strengthening in the near future. However, as +DI decreases and -DI rises, this change suggests that bearish momentum is beginning to overwhelm bullish momentum.
While trend strength remains weak, this pattern implies HBAR could continue its downward trend unless buying pressure overwhelms sellers.
HBAR Ichimoku Cloud, Weakness Signal After Failing to Break Key Resistance
Hedera's Ichimoku Cloud chart shows the price is still struggling below the cloud (Kumo), which reinforces the current bearish trend.
The price is currently trading below both the Conversion Line (Tenkan-sen) and Base Line (Kijun-sen). This confirms a lack of bullish momentum and that the short-term is undecided.
The forward cloud is red and thick, indicating strong resistance. The bearish bias is likely to continue until the price definitively breaks through this resistance area.
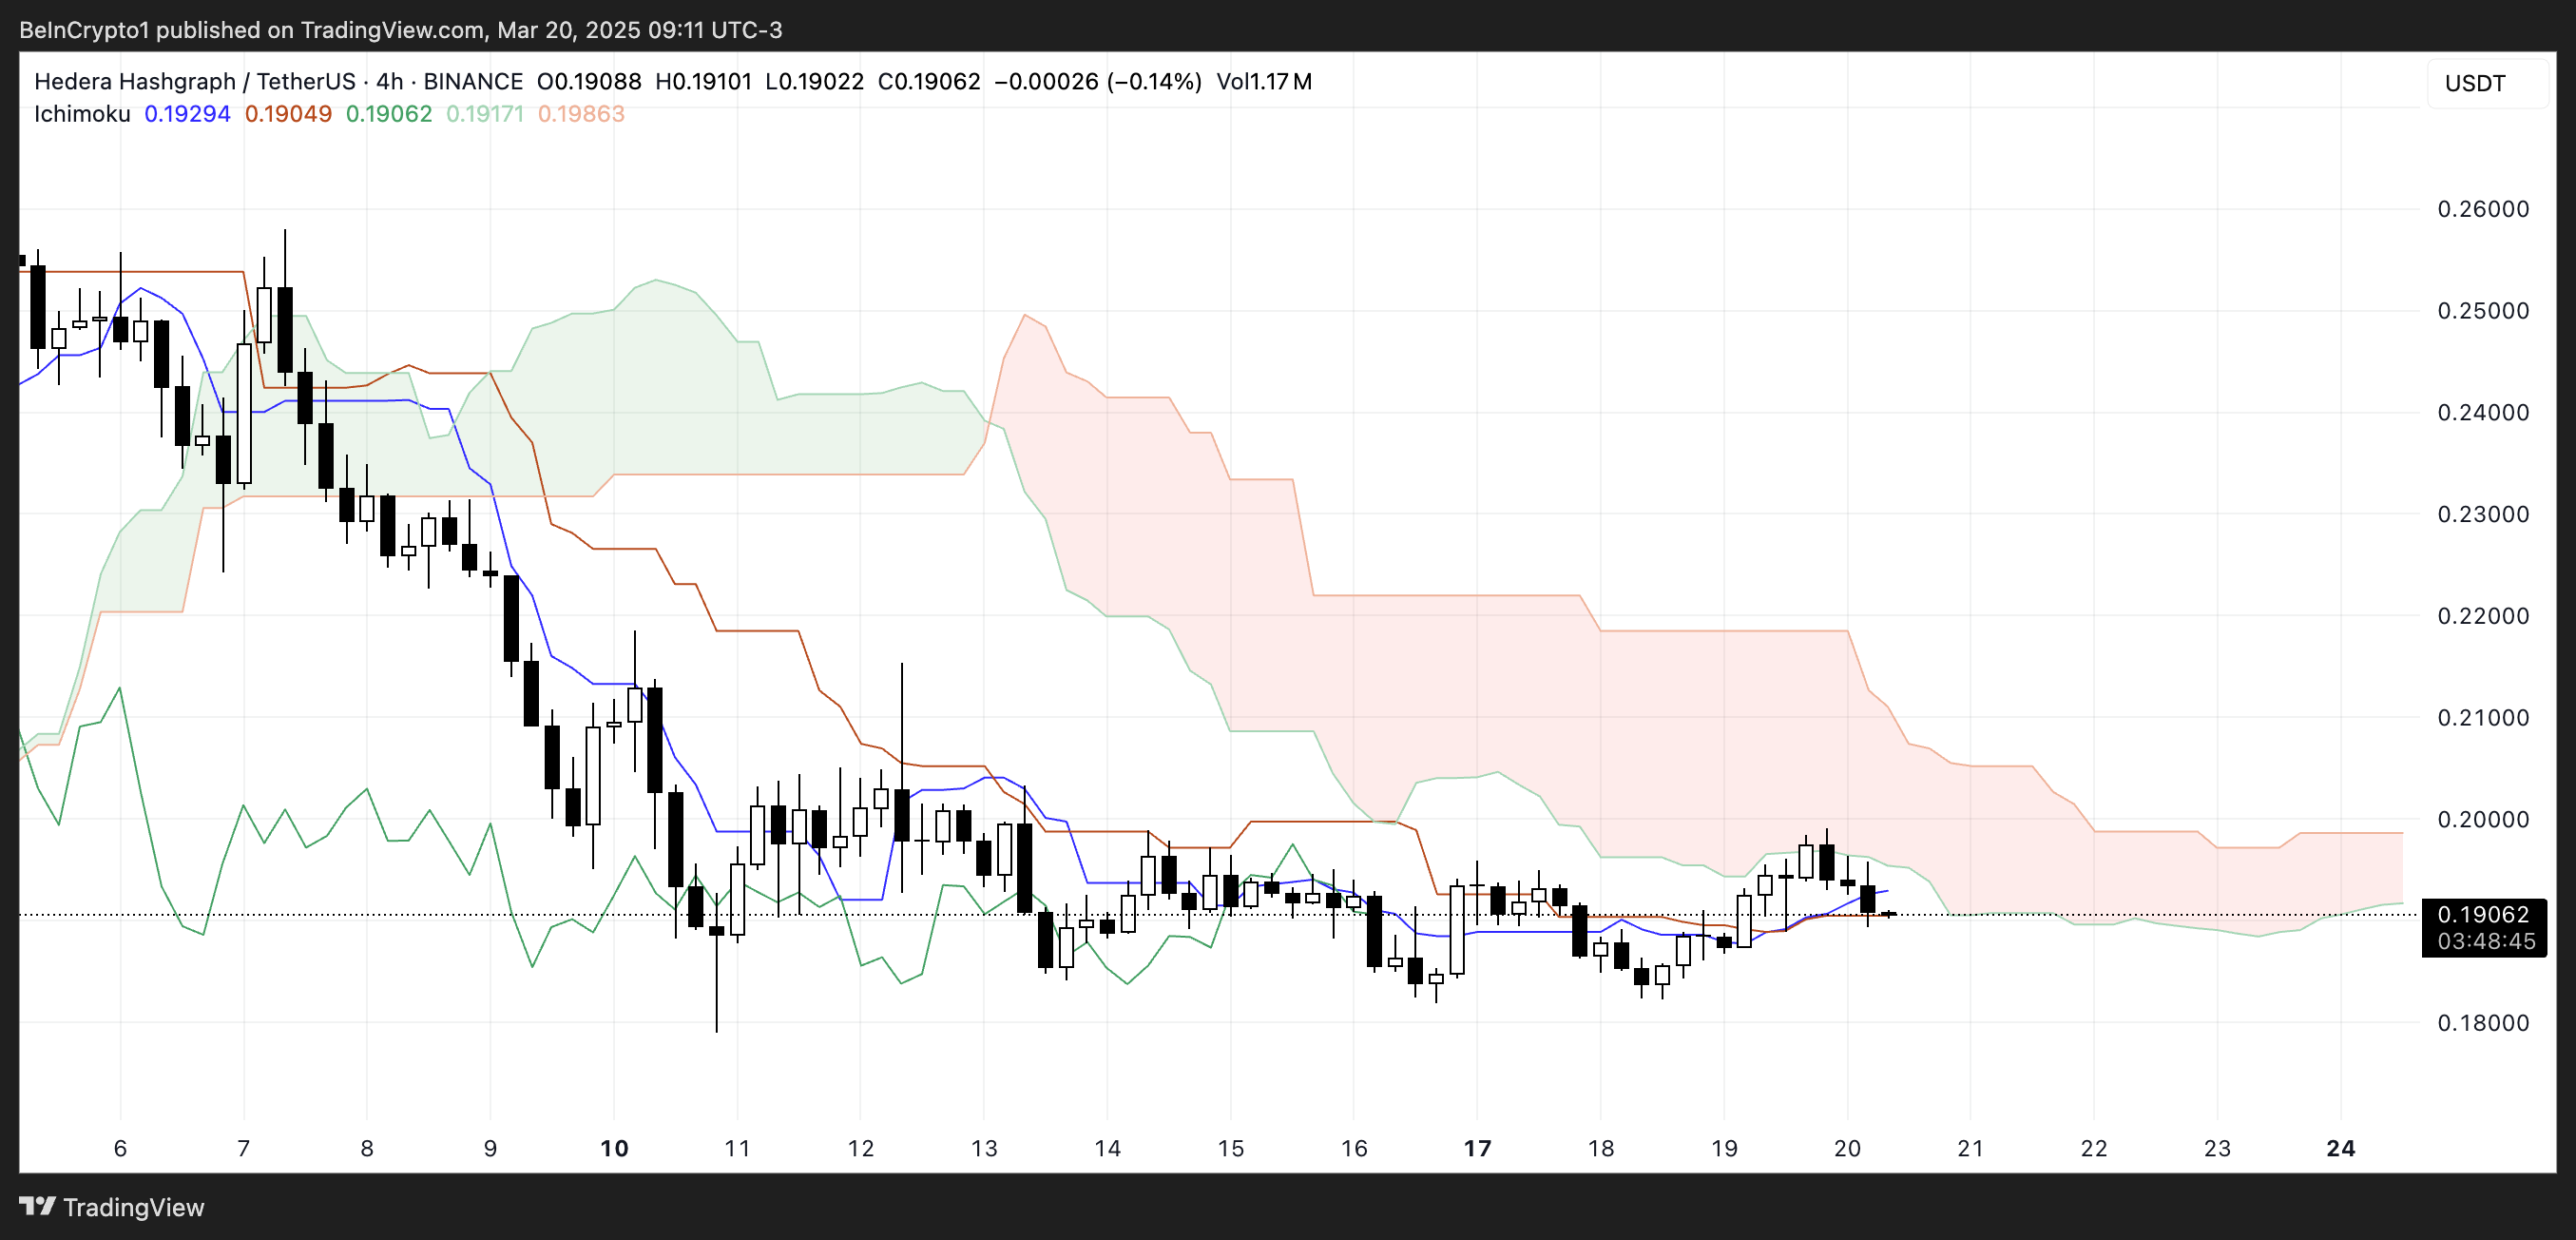
The Ichimoku Cloud system provides an overall view of support, resistance, trend direction, and momentum. When HBAR is below the cloud as it is now, the asset is considered to be in a downtrend.
The Conversion and Base Lines provide short-term signals. The Conversion Line being below the Base Line is a subtle bearish signal, but their proximity reflects a weak trend and potential consolidation.
With the price below both lines and the cloud acting as resistance above, HBAR is likely to be under pressure in the short term unless buying volume increases sufficiently to push it above the cloud and trigger a trend reversal.
Hedera, Falling Below $0.17 Soon?
Hedera's price is currently trading in a narrow range between a resistance level of $0.195 and a key support level of $0.184.
Price movements suggest that if the $0.184 support level is retested and not maintained, HBAR could quickly decline to test the next important support level at $0.178.
Losing that level could open the door to further decline, with the price potentially dropping below $0.17.
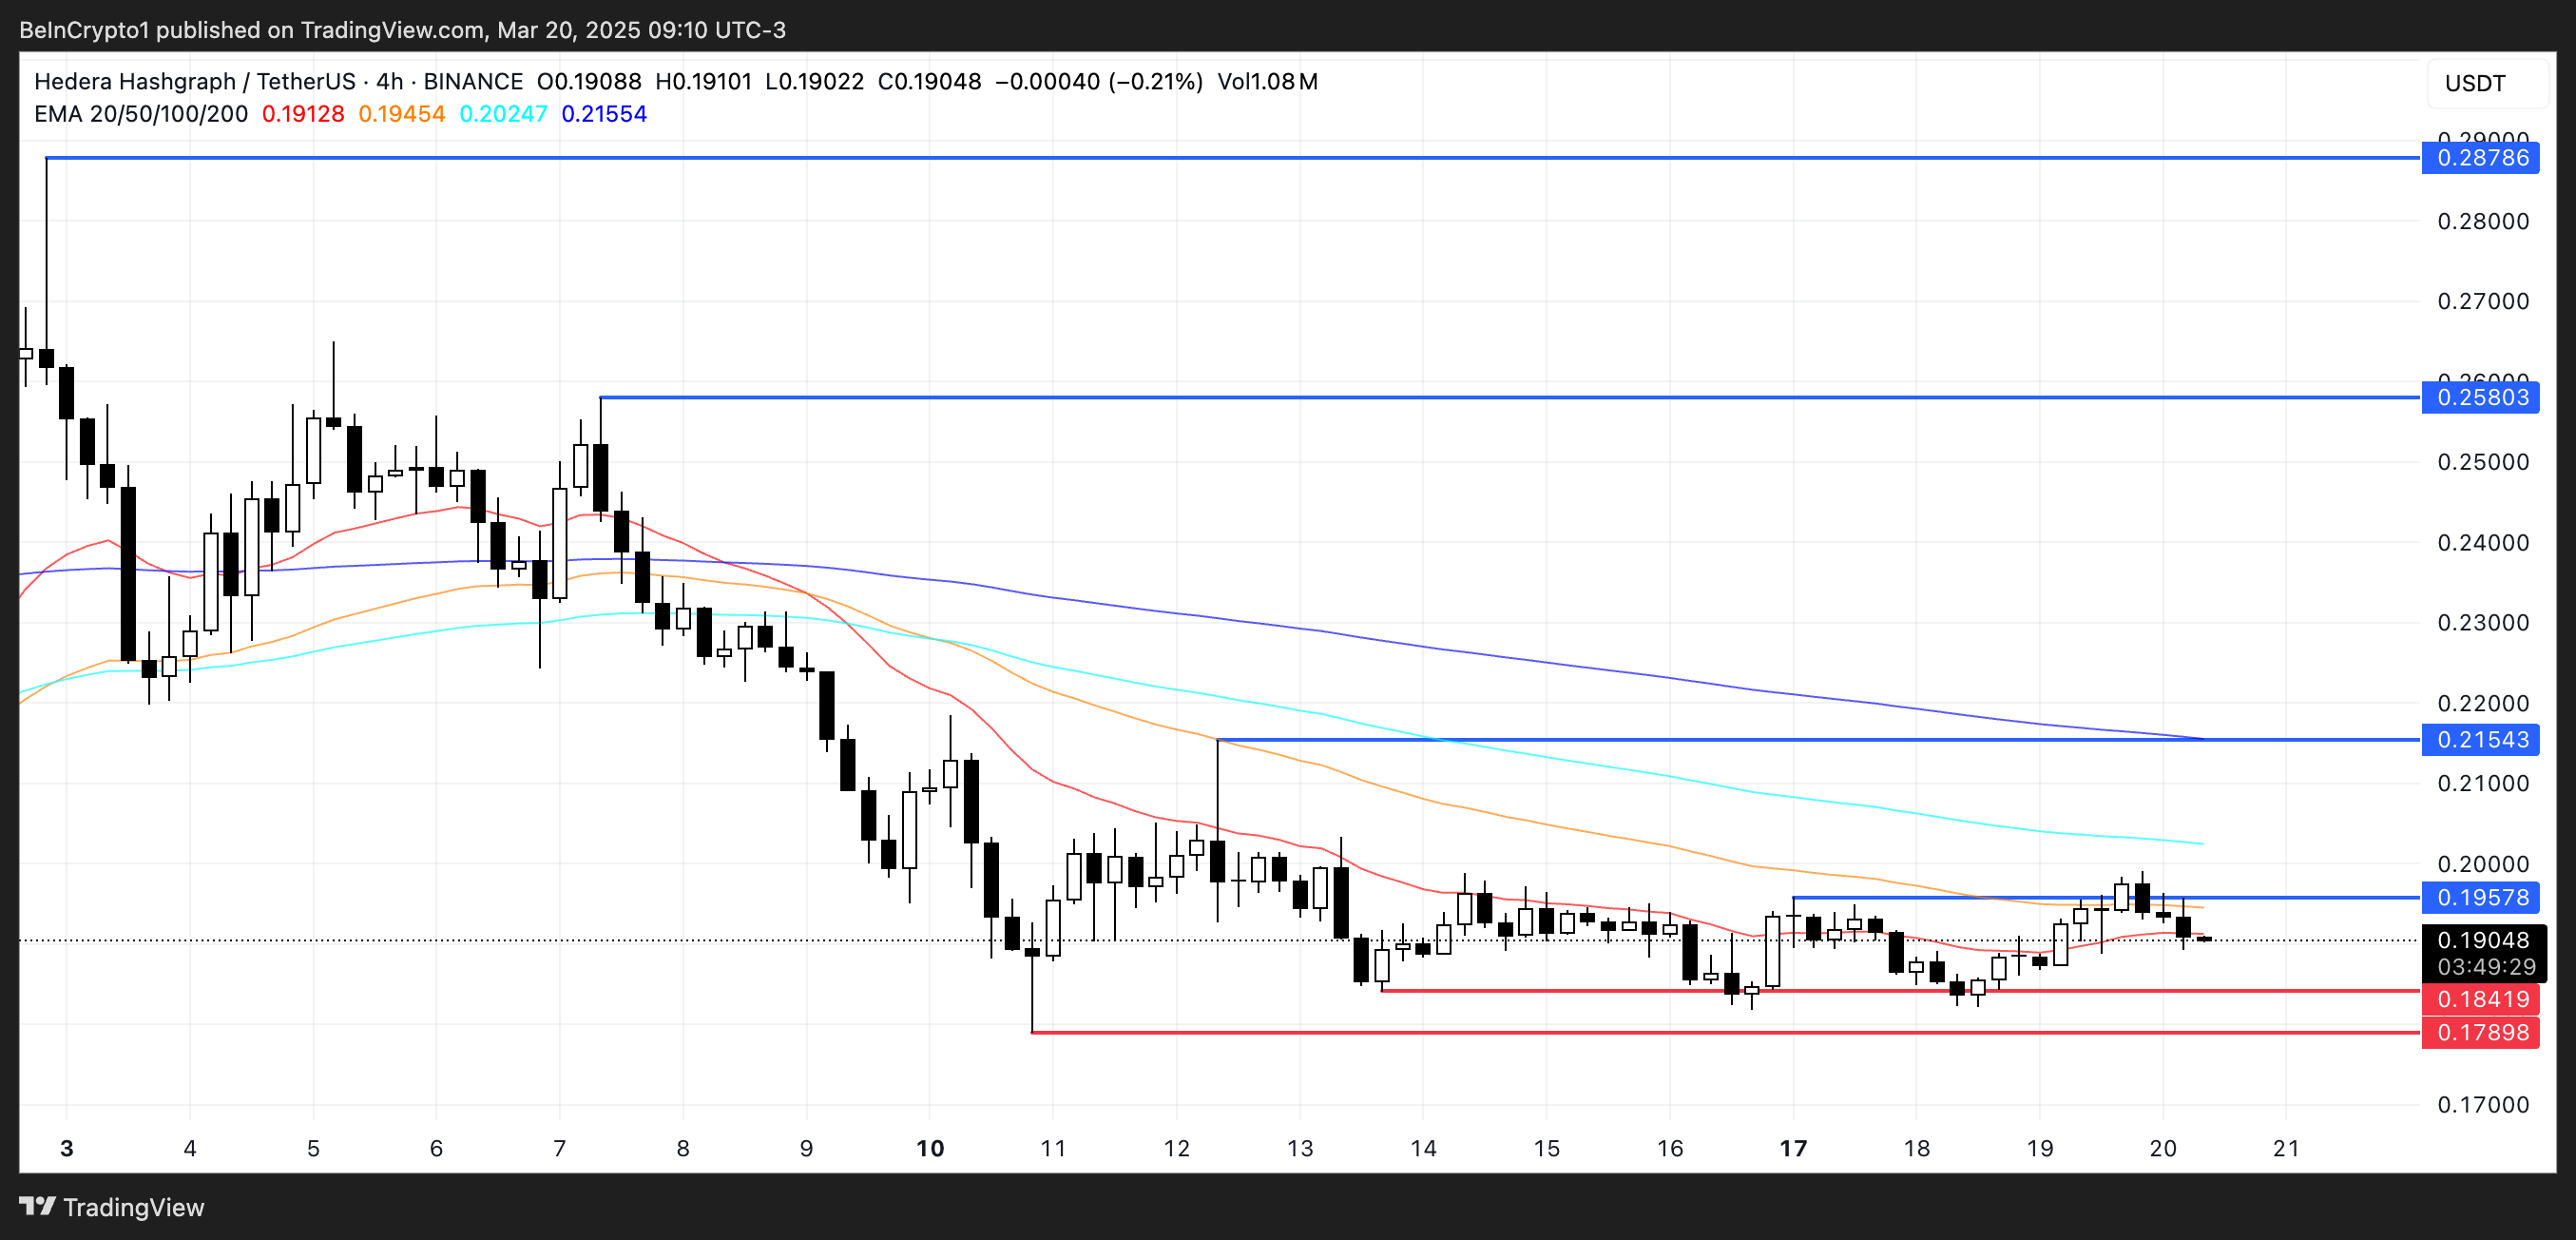
However, if HBAR can reverse this downtrend, the first obstacle is the $0.195 resistance. This is an area it attempted to break yesterday but failed.
Successfully breaking above $0.195 could reignite the uptrend and potentially trigger a move to the next resistance at $0.21.
If the uptrend strengthens further, the price could target higher levels of $0.258 and $0.287, possibly retesting the $0.30 level that HBAR hasn't touched since January 31st.

