

HyperLiquid (HYPE) is showing strong technical signals across multiple indicators, with the token surging over 15% in the past 24 hours. This platform has generated an impressive $47 million in fees over the past 30 days, outperforming major blockchain networks like Ethereum and Solana.
The technical indicators suggest a potential golden cross formation, implying that HYPE could test $21 or $25.80 going forward.
HyperLiquid Revenues, One of the Top Crypto Protocols
HyperLiquid is currently one of the most successful protocols in the cryptocurrency space. It has generated $47 million in fees over the past 30 days and recently reached $1 trillion in futures trading volume.
While it ranks behind major players like Jito, Pumpfun, and PancakeSwap in terms of monthly revenue, HyperLiquid has outperformed critical blockchain apps and chains such as Solana, Ethereum, Raydium, and Phantom.
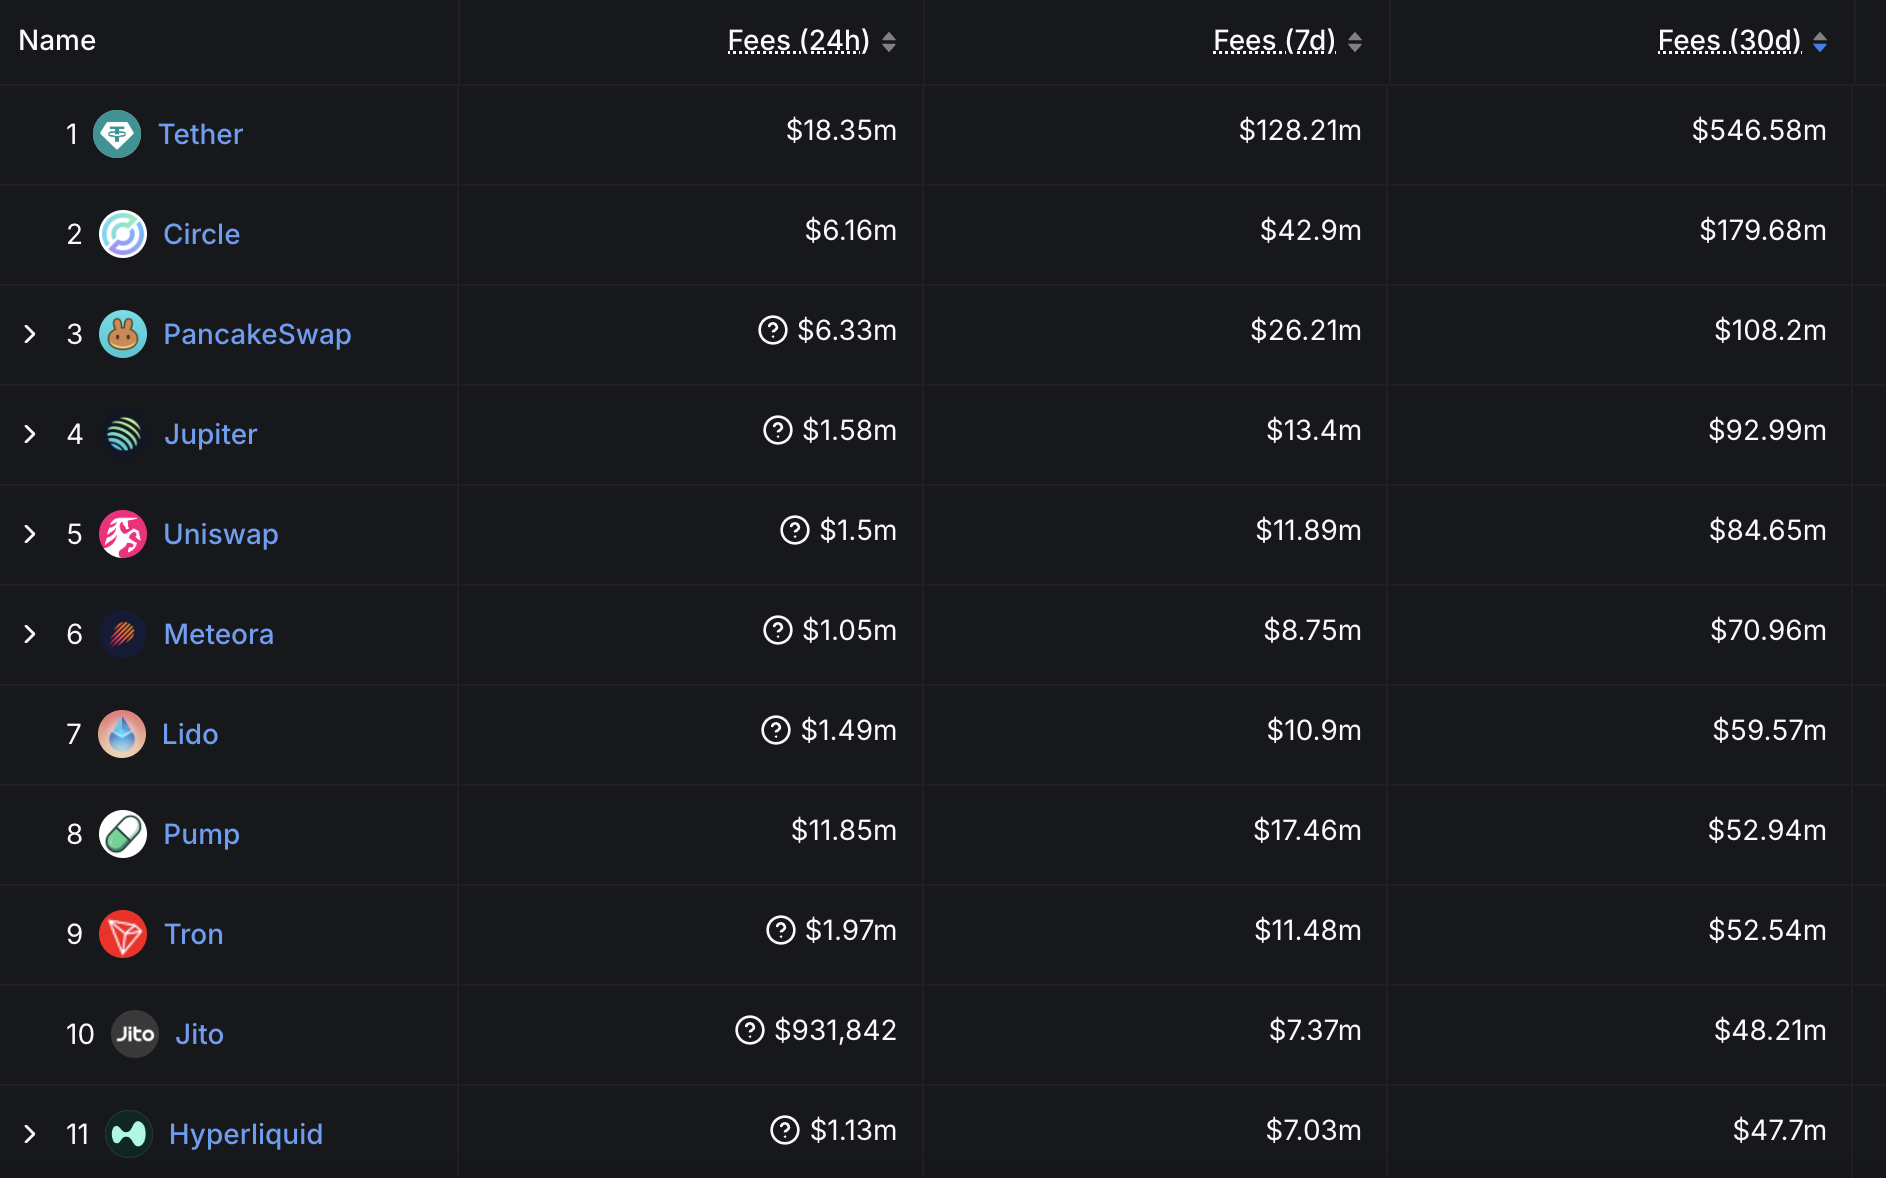
What makes HyperLiquid's success particularly noteworthy is that, unlike most other high-performance protocols operating on established blockchain networks like BNB, Solana, and Ethereum, HyperLiquid functions as an independent chain.
With the exception of TRON, almost all major protocols are dependent on their parent blockchains, but HyperLiquid has achieved substantial revenues as a standalone entity.
Despite this impressive performance and unique positioning, HYPE has recently experienced significant downward pressure. It has traded below $20 for 16 consecutive days, creating a noticeable disconnect between the protocol's operational success and its market valuation.
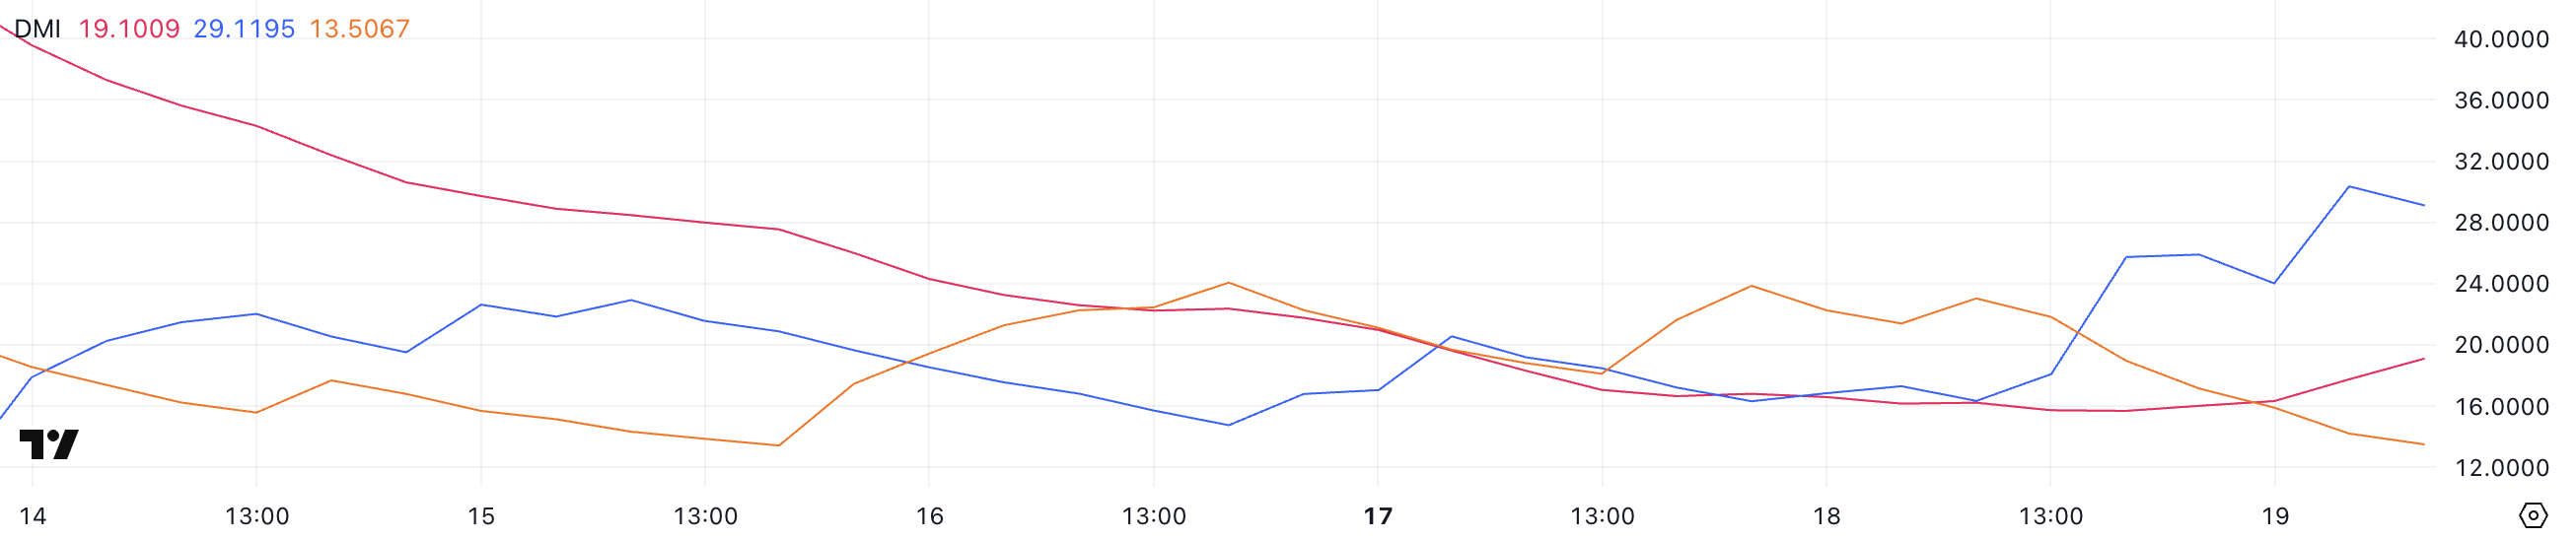
Bullish DMI, Buyers in Control
The HYPE DMI (Directional Movement Index) chart shows a promising momentum shift, with the ADX (Average Directional Index) rising from 15.7 to 19, suggesting strong trend conviction.
More importantly, the +DI (Positive Directional Indicator) has surged from 18 to 29.1, while the -DI (Negative Directional Indicator) has decreased from 21.8 to 13.5. This crossover pattern, where +DI exceeds -DI, generally signals a potential bullish reversal.
The increasing gap between these indicators and the rising ADX imply that buying pressure is overcoming selling pressure, opening the possibility for HYPE to break out of its recent $20 trading range.
The Relative Strength Index (RSI), a momentum measurement indicator, tracks the speed and change of price movements. Readings above 70 are generally considered overbought, while those below 30 are considered oversold.
The rise in HYPE's RSI from 54.5 to 66 indicates strong bullish momentum without reaching extreme levels. This increase suggests heightened buyer interest, with the RSI remaining below the overbought threshold of 70.
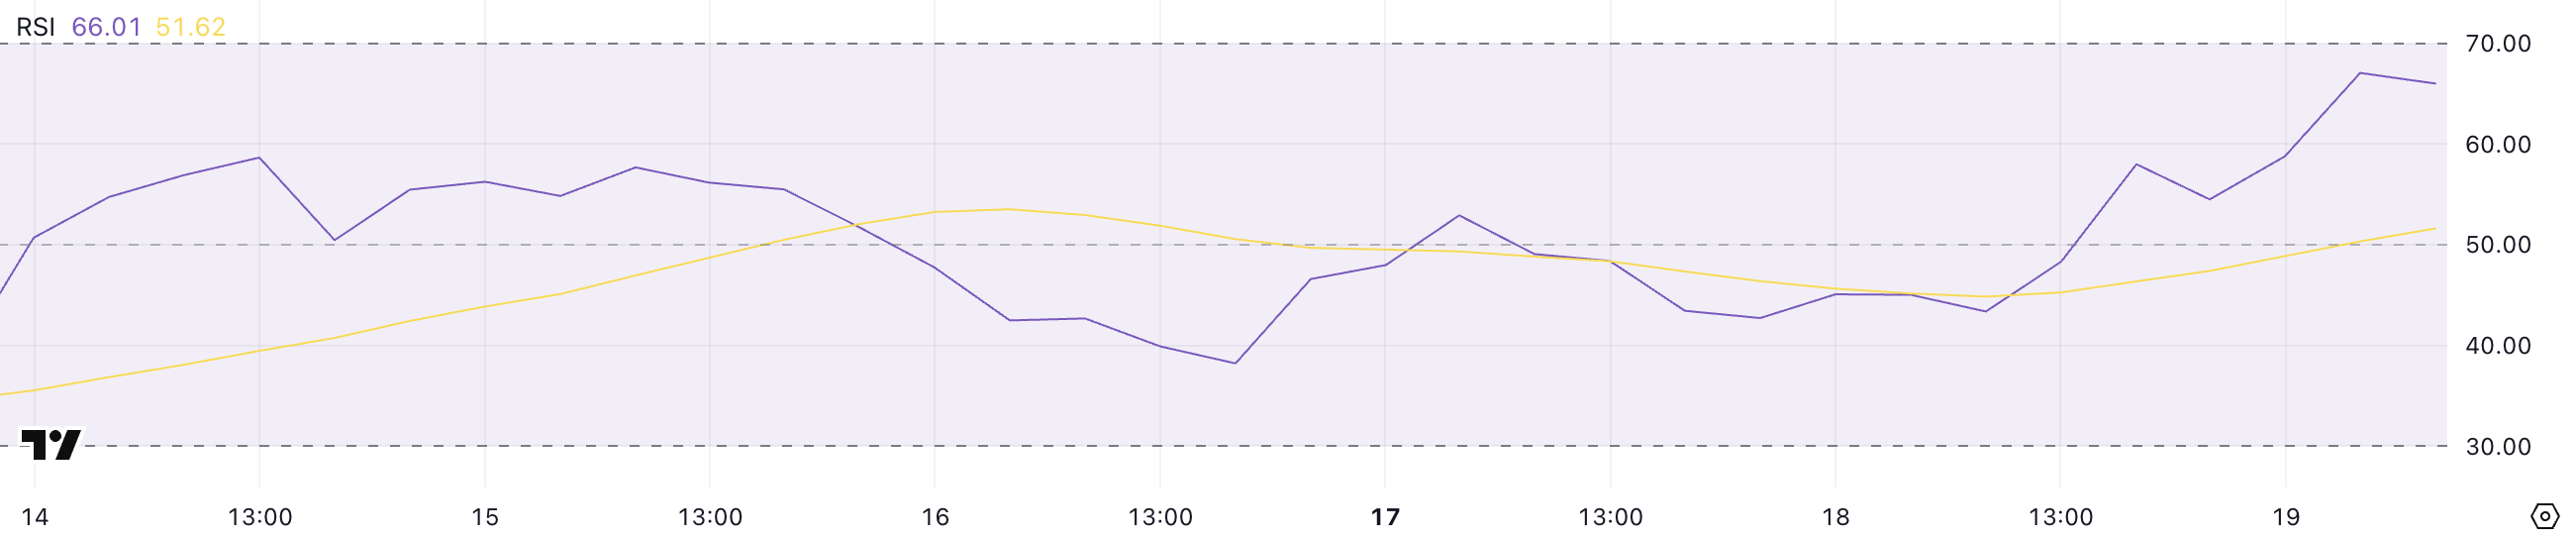
The fact that HYPE has not reached overbought levels since December 2024 implies that there may still be room for price appreciation before a potential correction.
Together with the DMI indicators, this RSI reading further strengthens the likelihood of HYPE's price continuing to rise in the short term.
Will HyperLiquid Break $20 This Week?
The HYPE exponential moving average (EMA) lines are converging towards a potential golden cross formation, which occurs when the short-term moving average crosses above the long-term moving average.
This technical pattern generally signals a powerful shift in bullish momentum, and HYPE could test the immediate resistance level of $17. If buyers successfully breach this threshold, the path could open for HYPE to rise to the $21 level.
In the event of exceptional buying pressure, HyperLiquid could continue its upward trajectory. This would be a significant recovery from the recent $20 trading range and could challenge the crucial $25.80 resistance level.
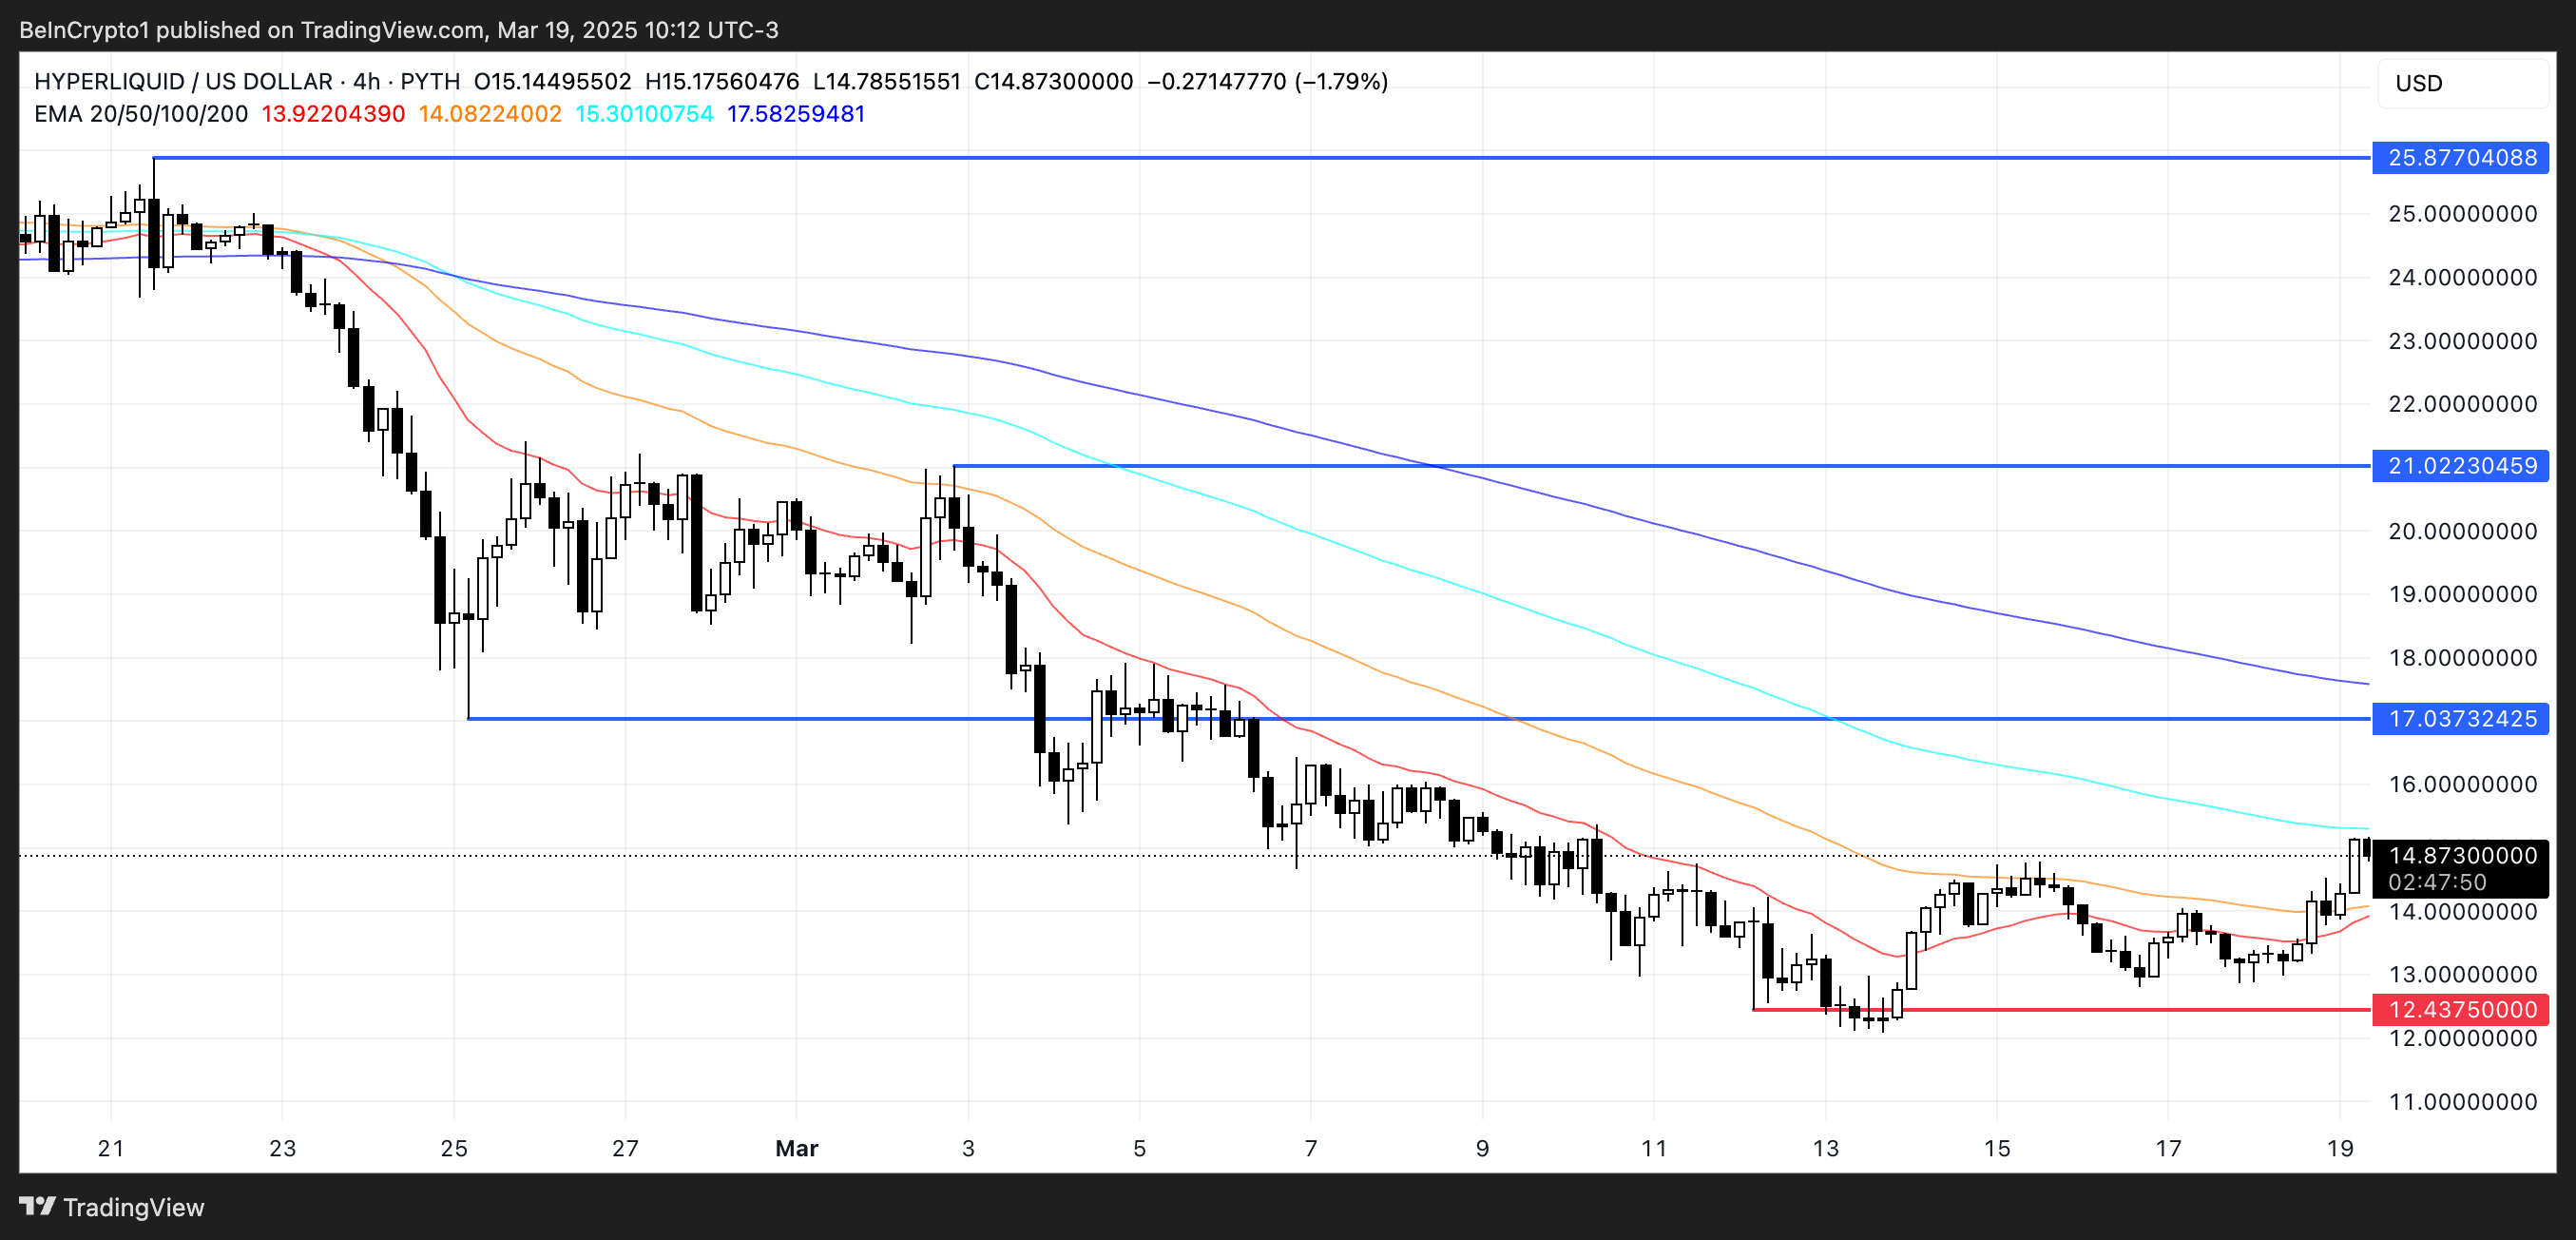
Conversely, if the anticipated bullish momentum fails to materialize and a bearish trend prevails, HYPE could test the critical support level of $12.43.
The significance of this support cannot be overstated. A breakdown below this level could accelerate selling pressure, potentially pushing HYPE below the psychologically important $12 for the first time since December 2024.


