Bitcoin (BTC) has recently recorded an all-time high. However, according to several on-chain indicators, this is not the peak of the current upward cycle.
According to four on-chain indicators provided by Lookonchain, BTC is expected to reach $200,000 in this cycle.
BTC's Highest Price This Season at $200,000?
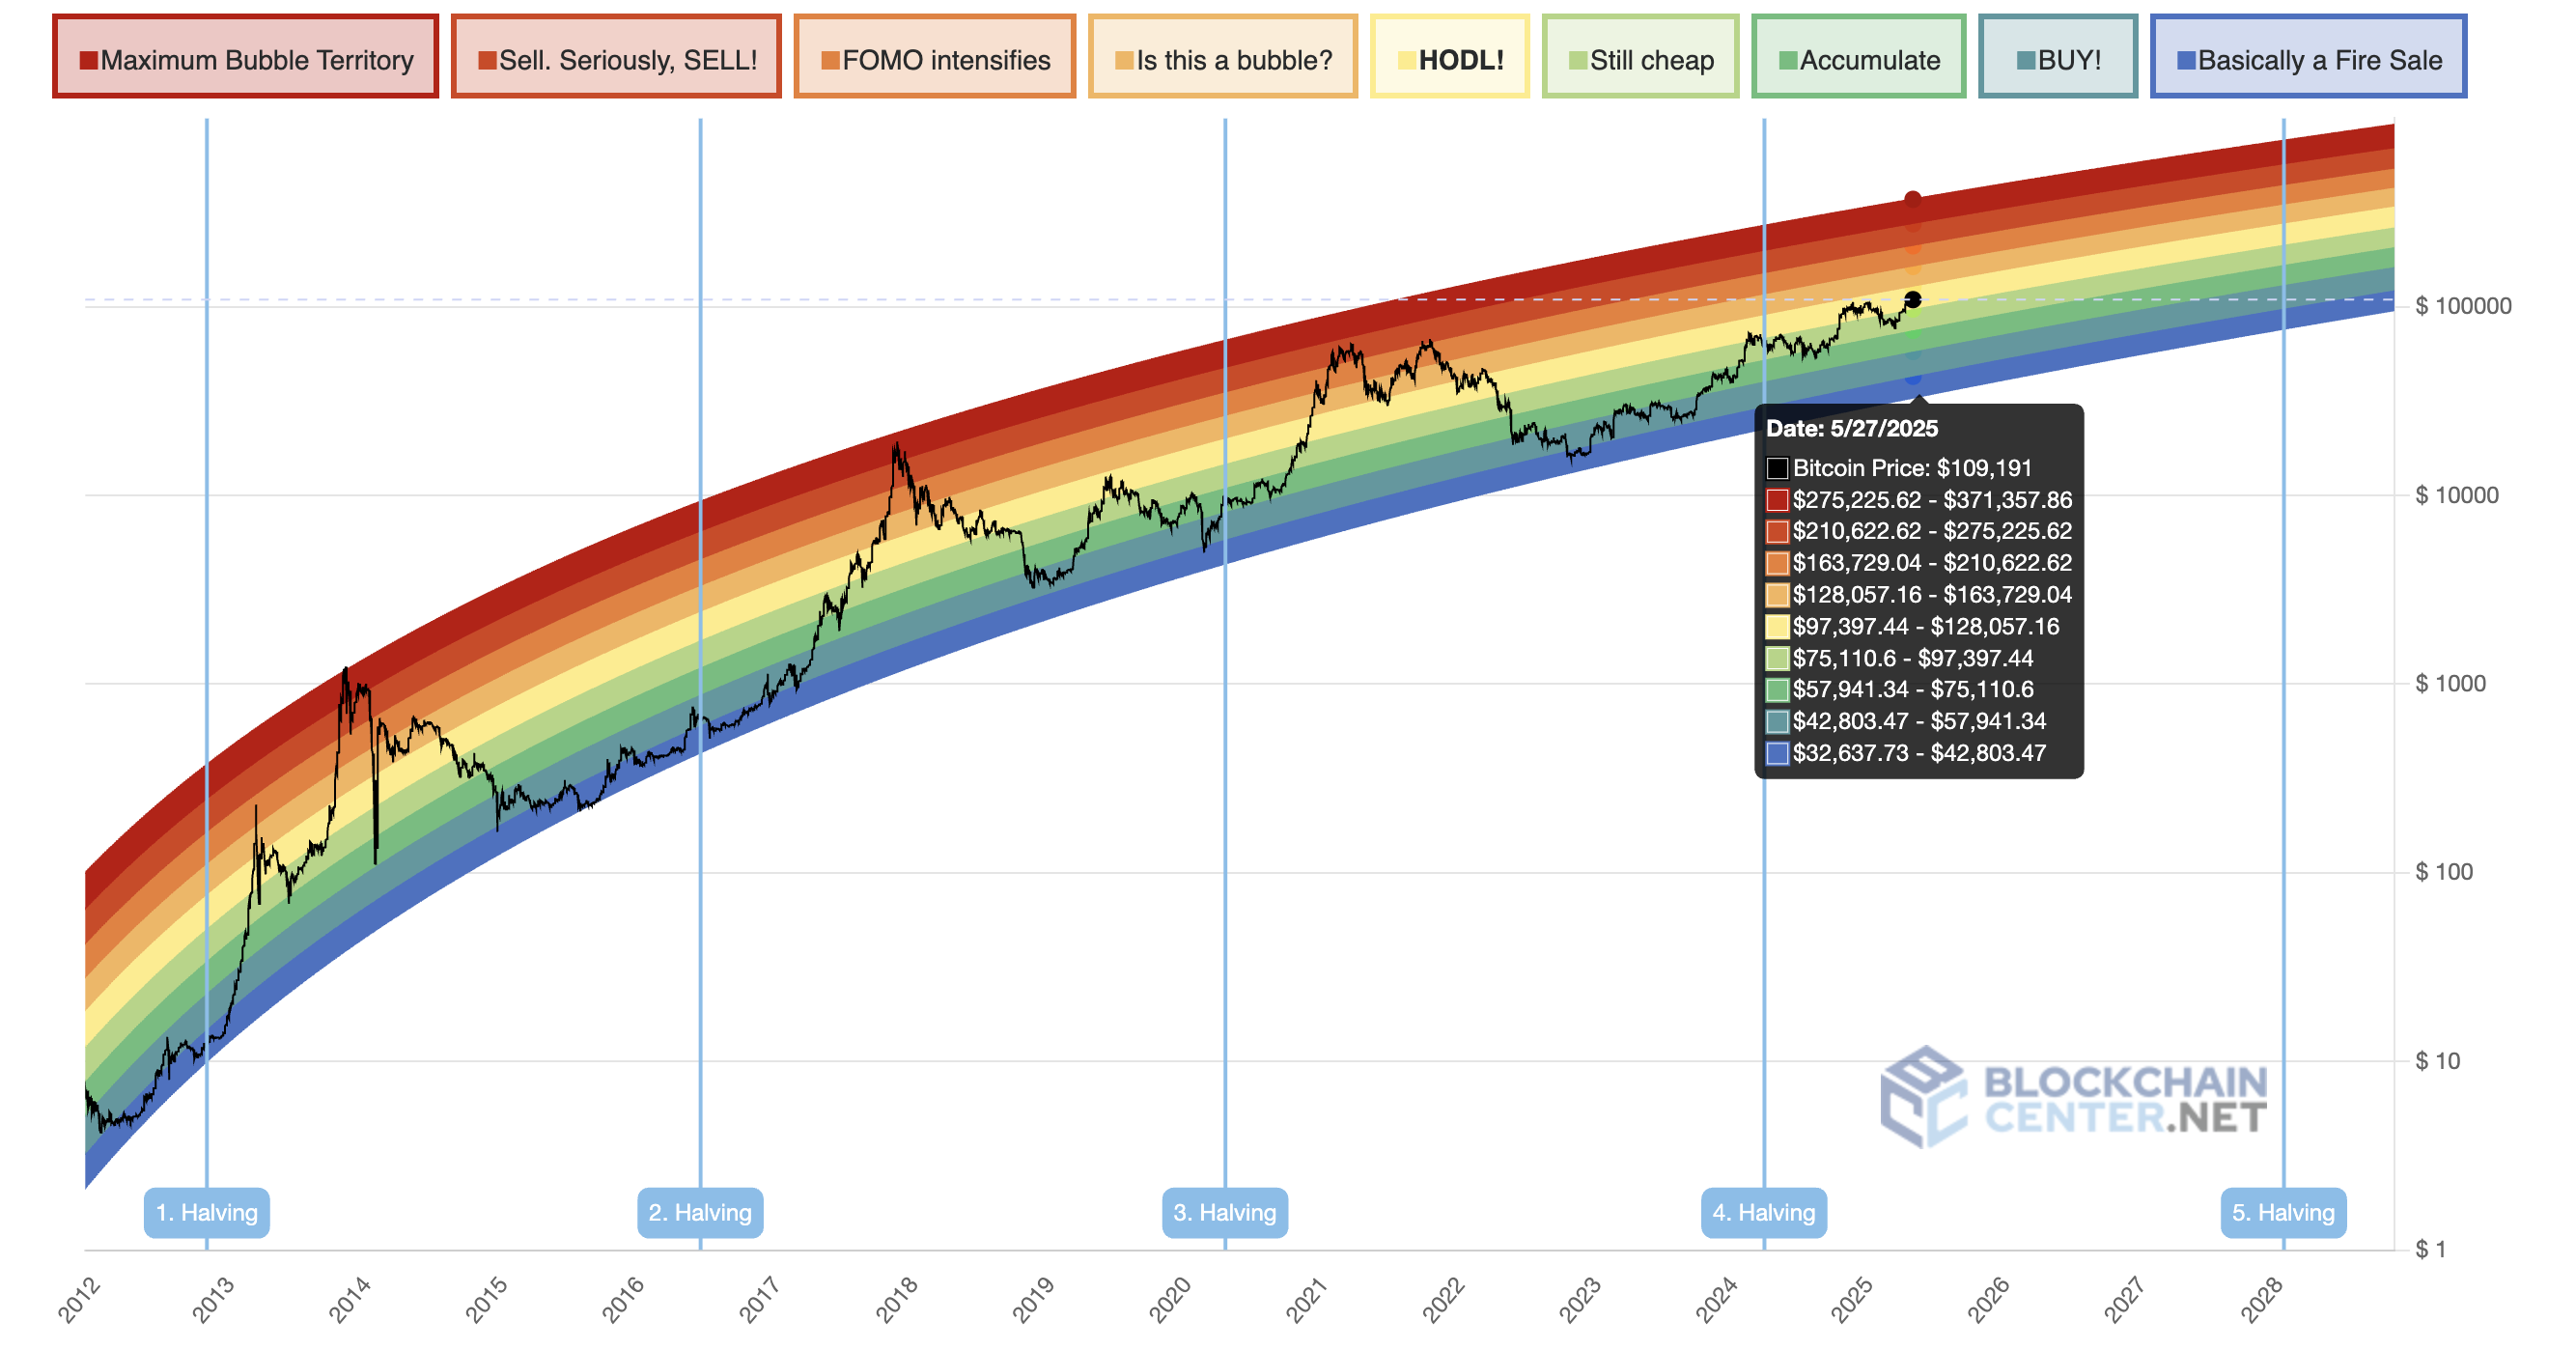
First, the $200,000 target is predicted using the 2023 Rainbow Chart. This long-term evaluation tool uses a logarithmic growth curve to predict the potential future price direction of BTC. If this prediction is correct, Bitcoin has completed about half of its journey in this cycle.
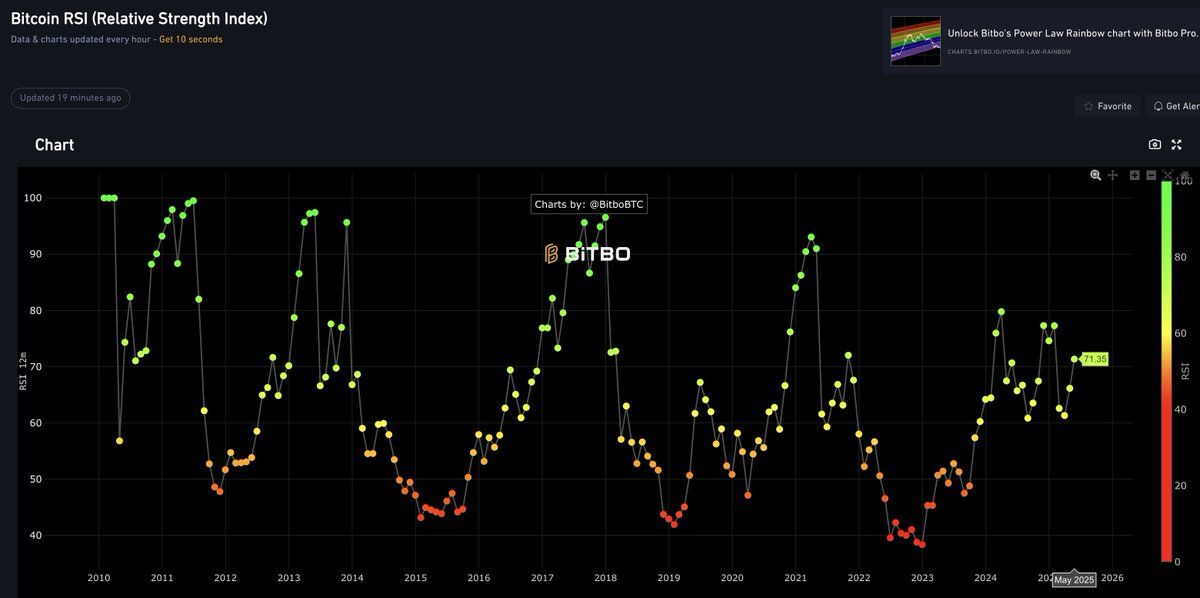
Second, Bitcoin's Relative Strength Index (RSI) is 71.35. When this indicator exceeds 70, BTC is considered overbought and may soon decline. Conversely, if it is below 30, BTC is oversold and may soon rise.
At the current level, Bitcoin is slightly in the "overbought" zone, but there is room for growth compared to historical peaks. BTC typically reaches its peak when the RSI exceeds 90.
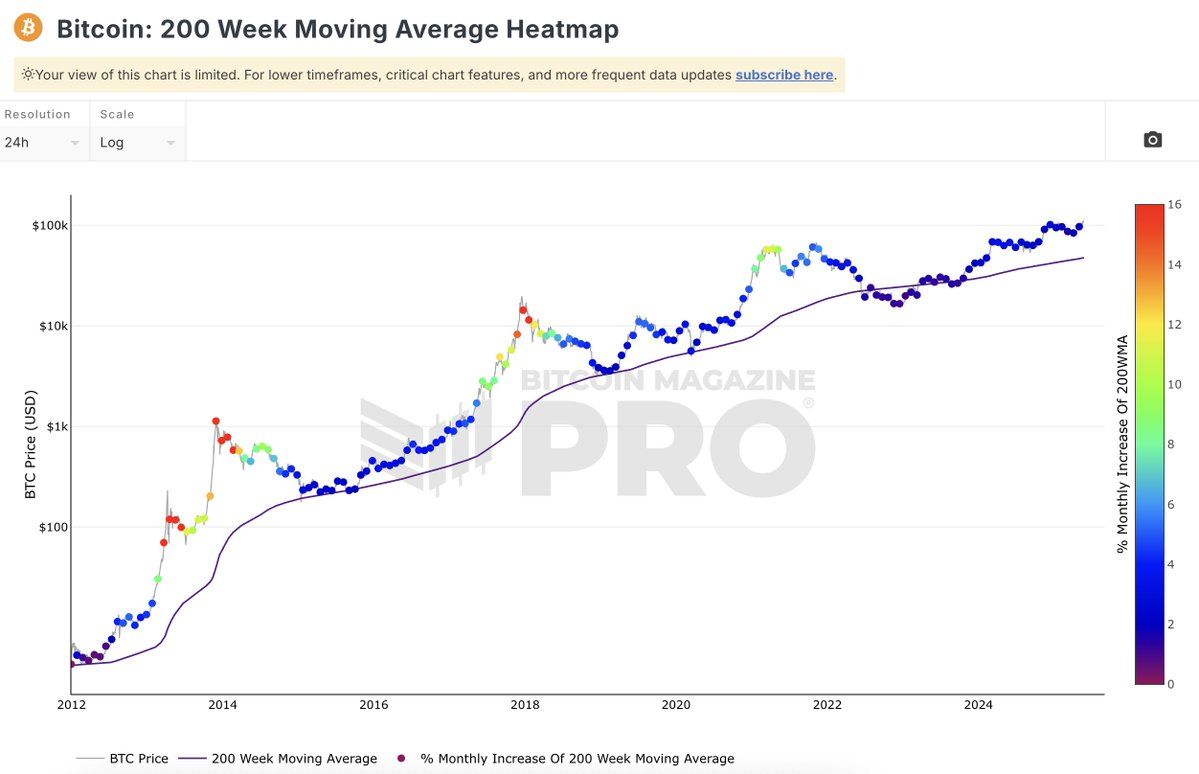
Third, the 200-week Moving Average (MA) heatmap is in the blue zone. This suggests that the price has not yet reached its peak and is an appropriate time to hold or buy.
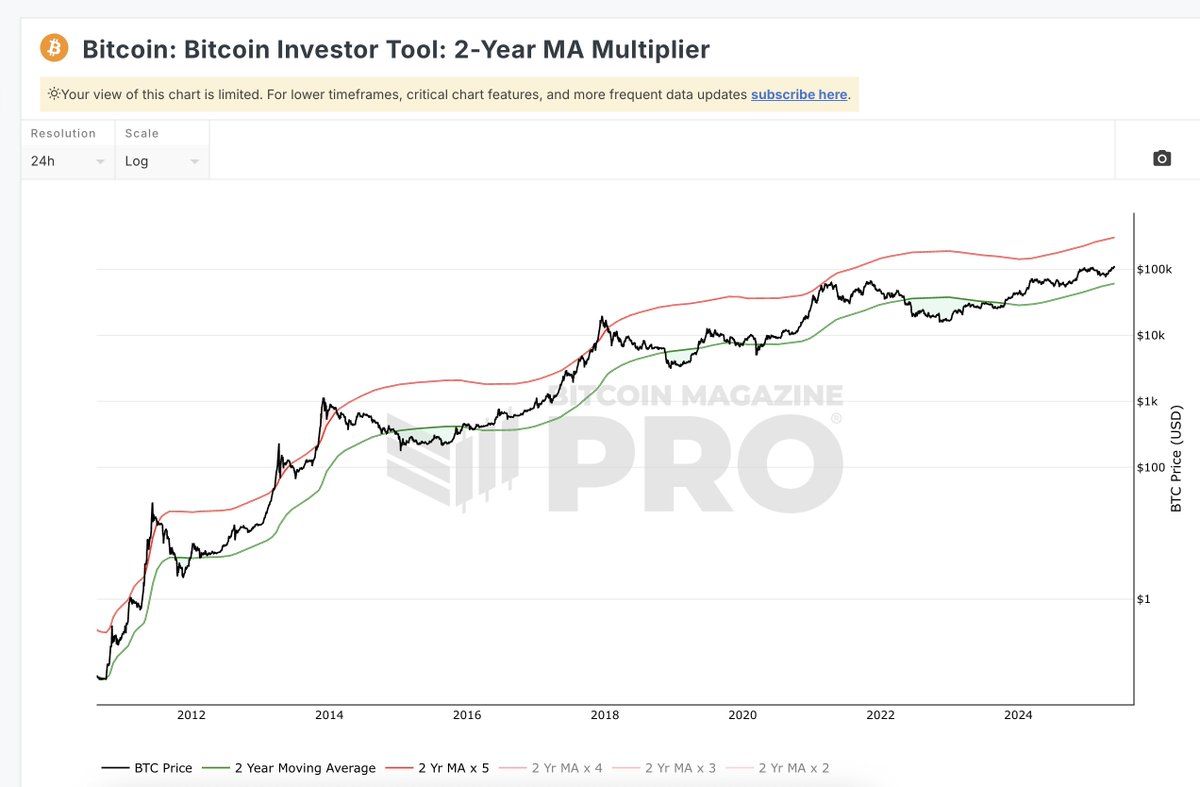
Lastly, the 2-year MA Multiplier shows that the current price is between the red and green lines. Since the price has not yet touched the red line, the market has not reached its peak.
Bitcoin's Growth Potential Remains
In addition to the technical indicators mentioned above, there are several on-chain data points supporting Bitcoin's continued growth potential.
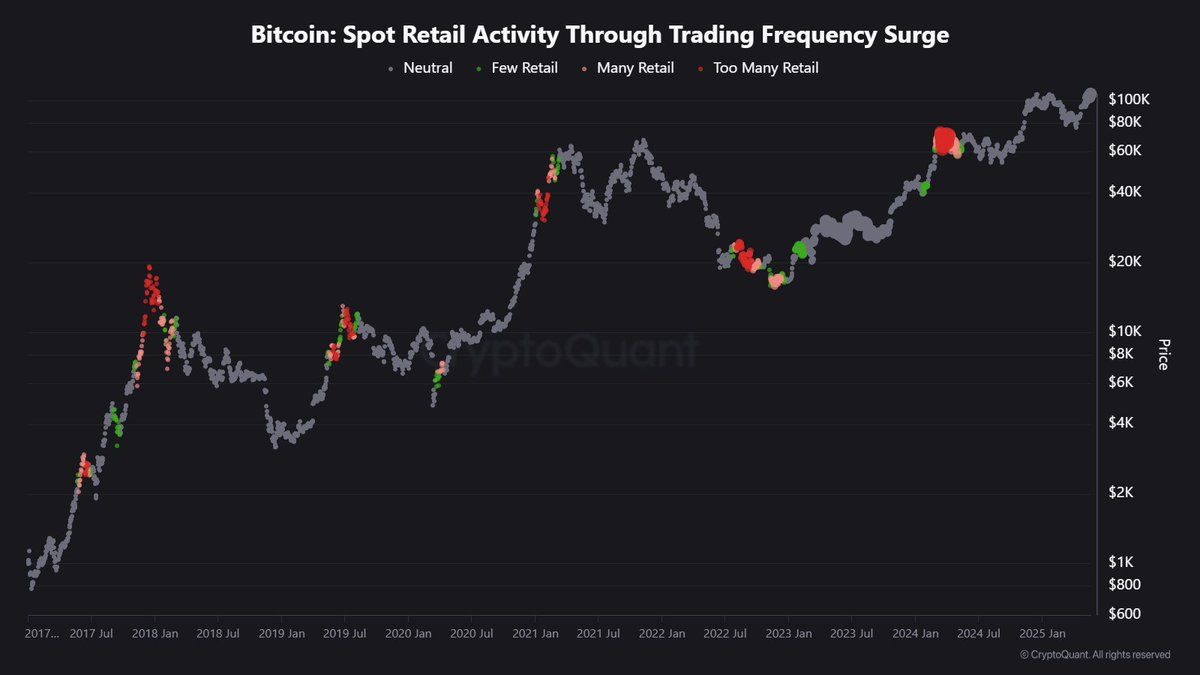
According to CryptoQuant, retail investors are still largely on the sidelines, and current Bitcoin trading volume is lower than the one-year average. This indicates that the market has not yet entered the "FOMO" (fear of missing out) state, which is often a signal that appears when prices reach their peak.
Additionally, CryptoQuant's Bitcoin on-chain analyst mentioned that when BTC corrected below $111,000 and $109,000, short-term holders using excessive leverage were liquidated. Meanwhile, BTC long-term holders (LTHs) used this price drop to increase their Bitcoin holdings.
As a result, the realized market cap of long-term holders has exceeded $28 billion, the first time since April. The realized market cap measures the value at the last point of movement of Bitcoin, which differs from the current market price.
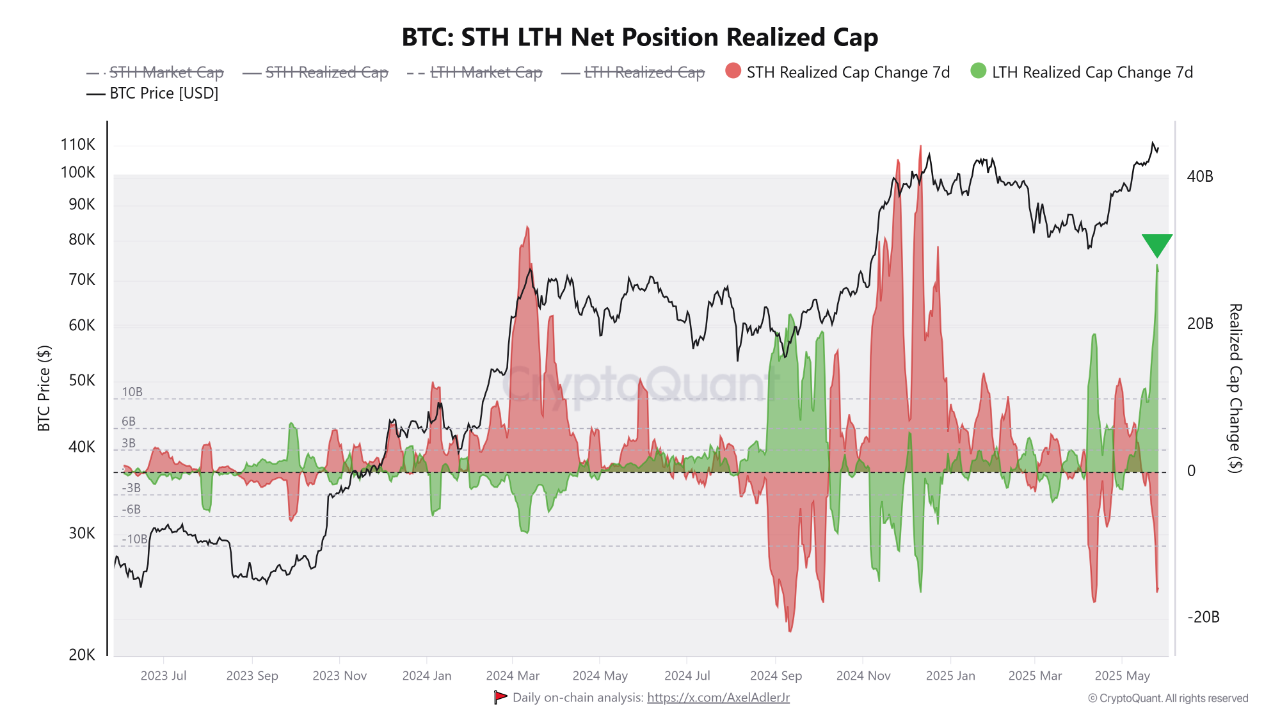
"Long-term investors are increasing their Bitcoin holdings during periods of forced selling. Such strategic accumulation during market stress reflects the deep conviction of long-term holders." – Analyst from cryptocurrency on-chain platform CryptoQuant stated.
Based on technical analysis and market data, Bitcoin has not yet reached its peak in the current cycle. However, investors should pay attention to short-term volatility and macroeconomic factors that could impact the market.


