

The major cryptocurrency Bitcoin briefly exceeded $107,000 yesterday. It recorded an intraday high of $107,108, which is about 2% short of the all-time high of $109,588, and then entered a correction phase.
Major cryptocurrencies subsequently slightly declined, with the price at $104,976 at the time of reporting. Market sentiment remains strong, and on-chain indicators suggest continued upward momentum.
Bitcoin Season in Full Swing
According to Blockchain Center's data, the cryptocurrency market is still deeply immersed in a "Bitcoin season". During this period, BTC significantly outperforms the broader altcoin market.
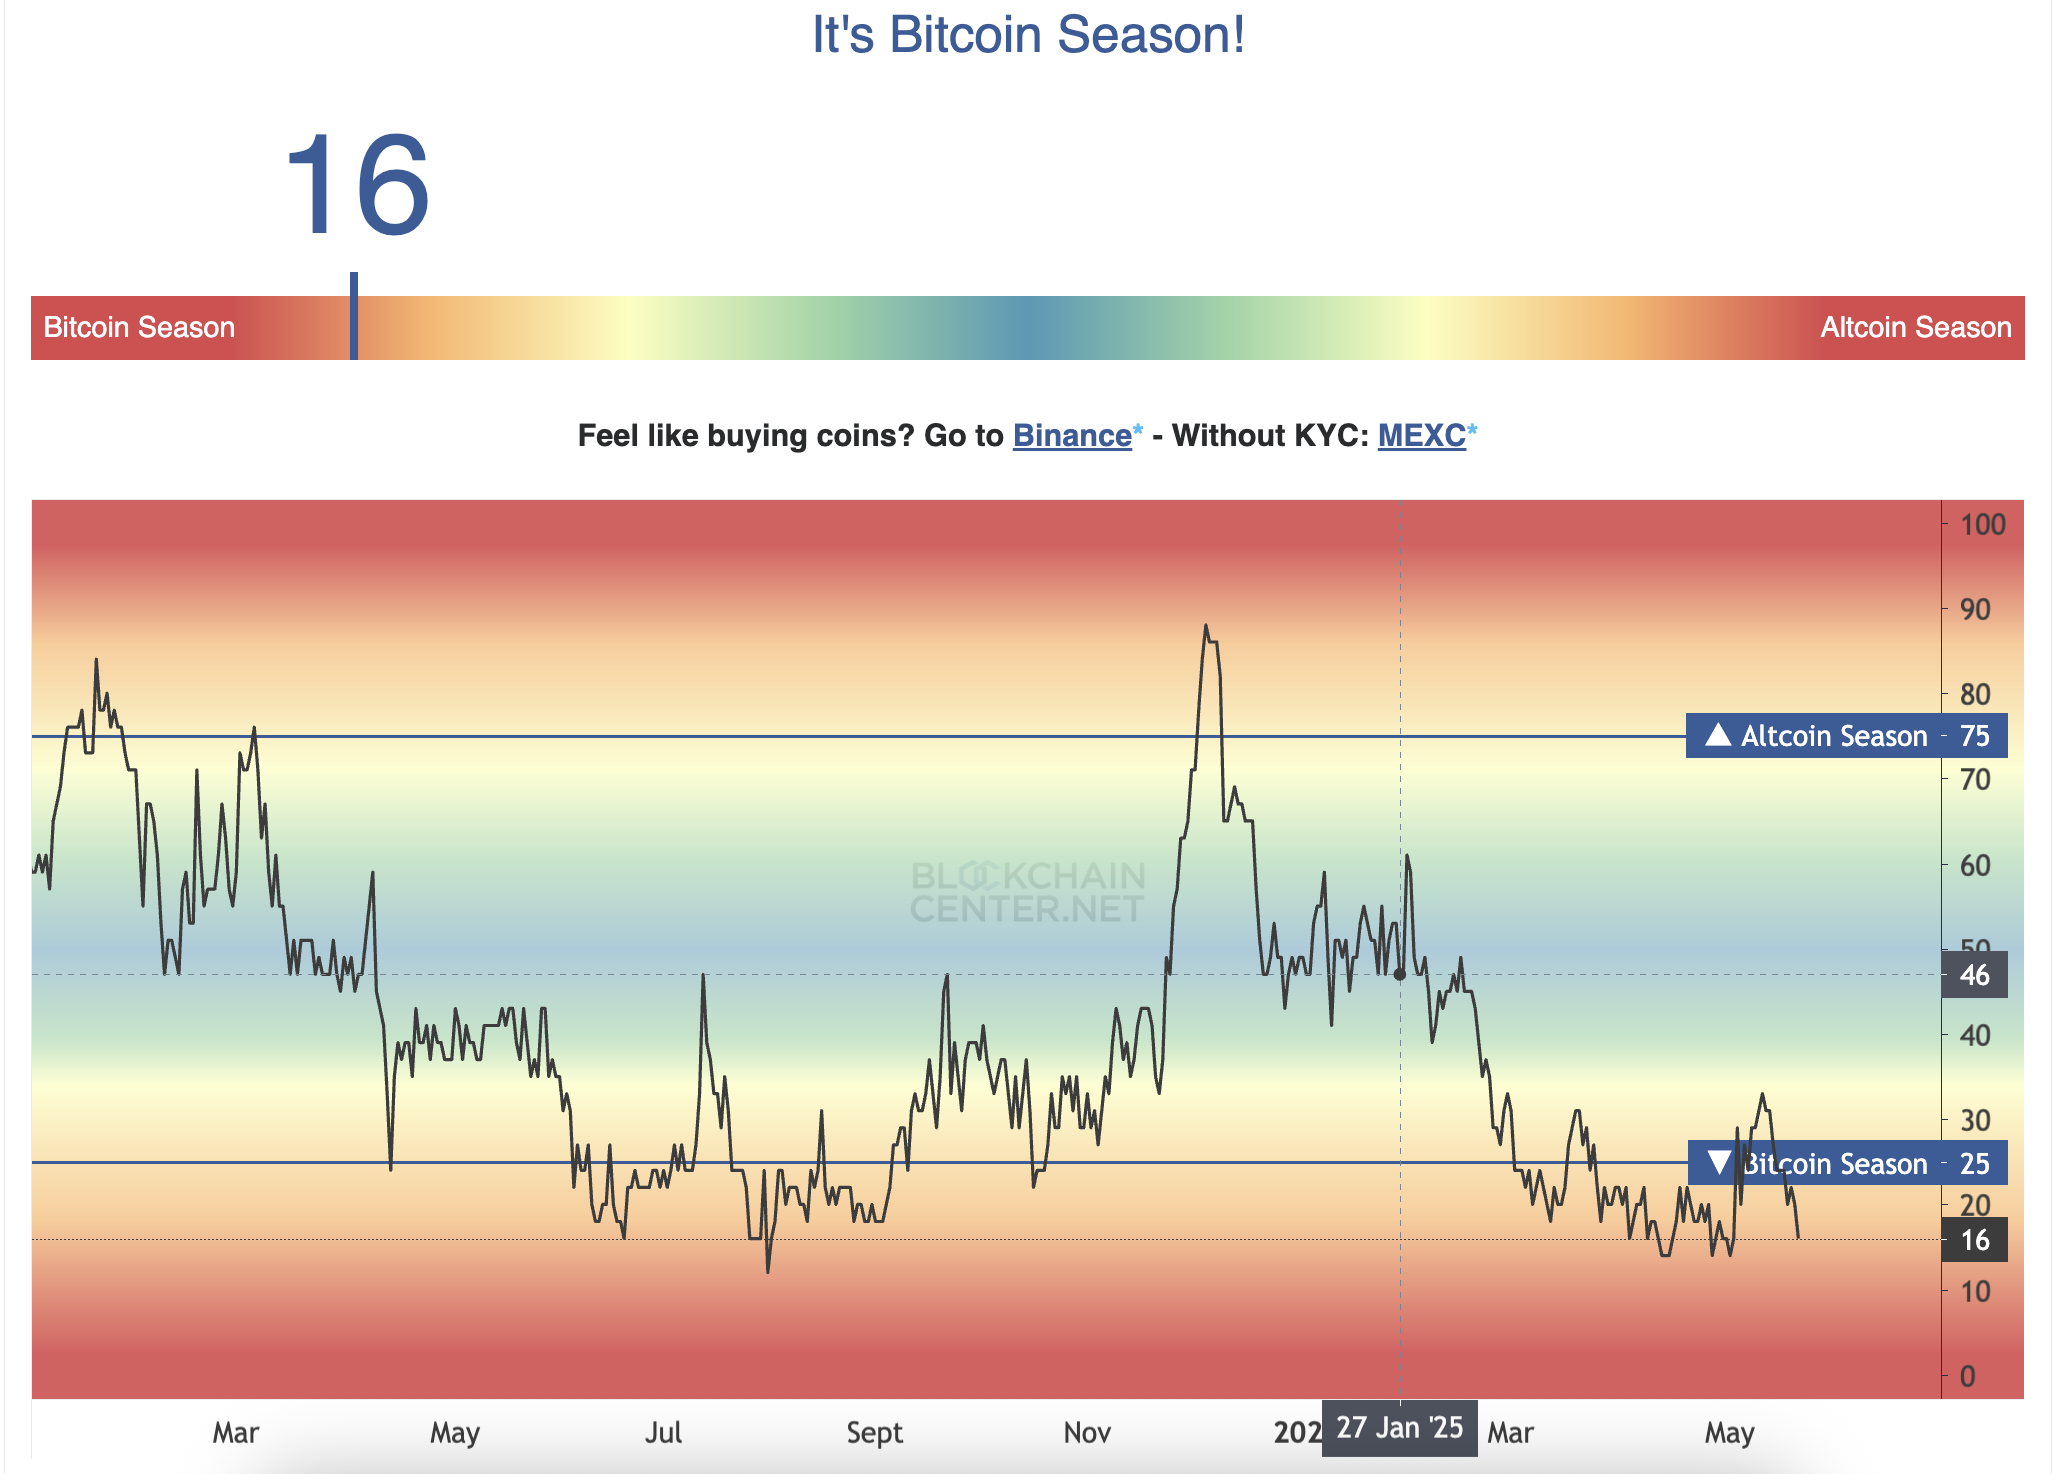
Currently, only 16 out of the top 50 altcoins (32%) have outperformed BTC over the past 90 days. This falls far short of the 75% threshold considered an "altcoin season".
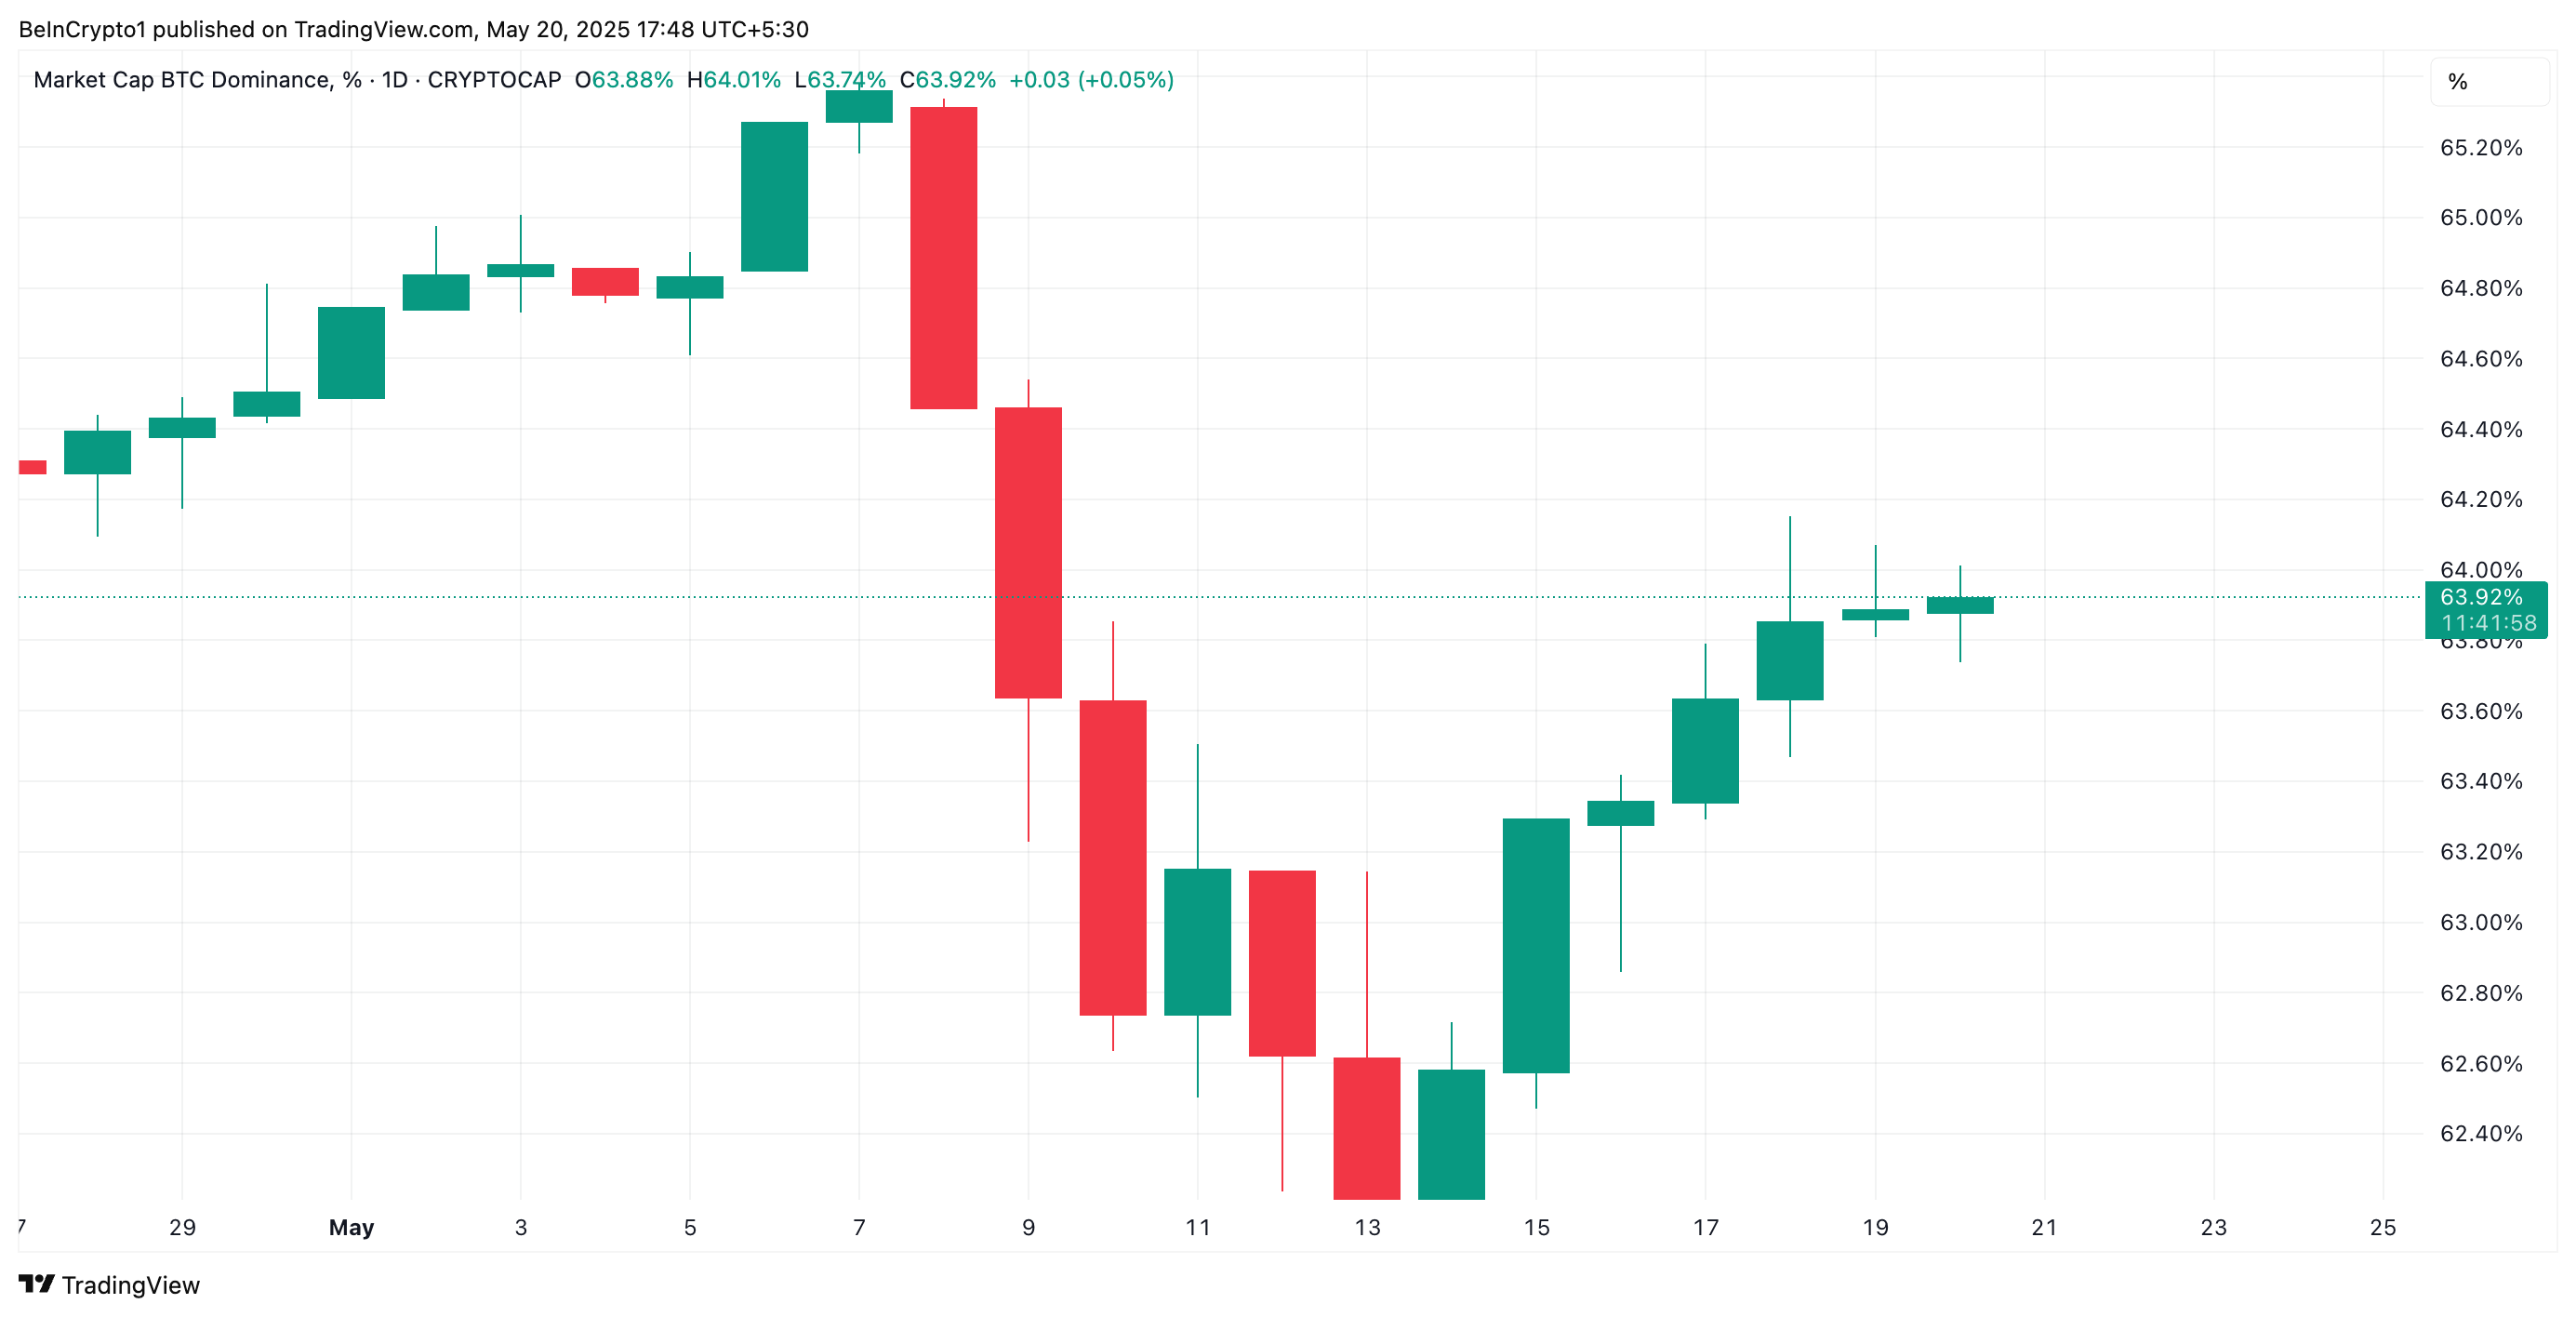
Additionally, Bitcoin's rising dominance supports this stance. BTC.D, the indicator tracking BTC's total cryptocurrency market capitalization share, has steadily increased after reaching a two-month low of 61.89% on May 16th.
Currently, this indicator is at 63.92%.
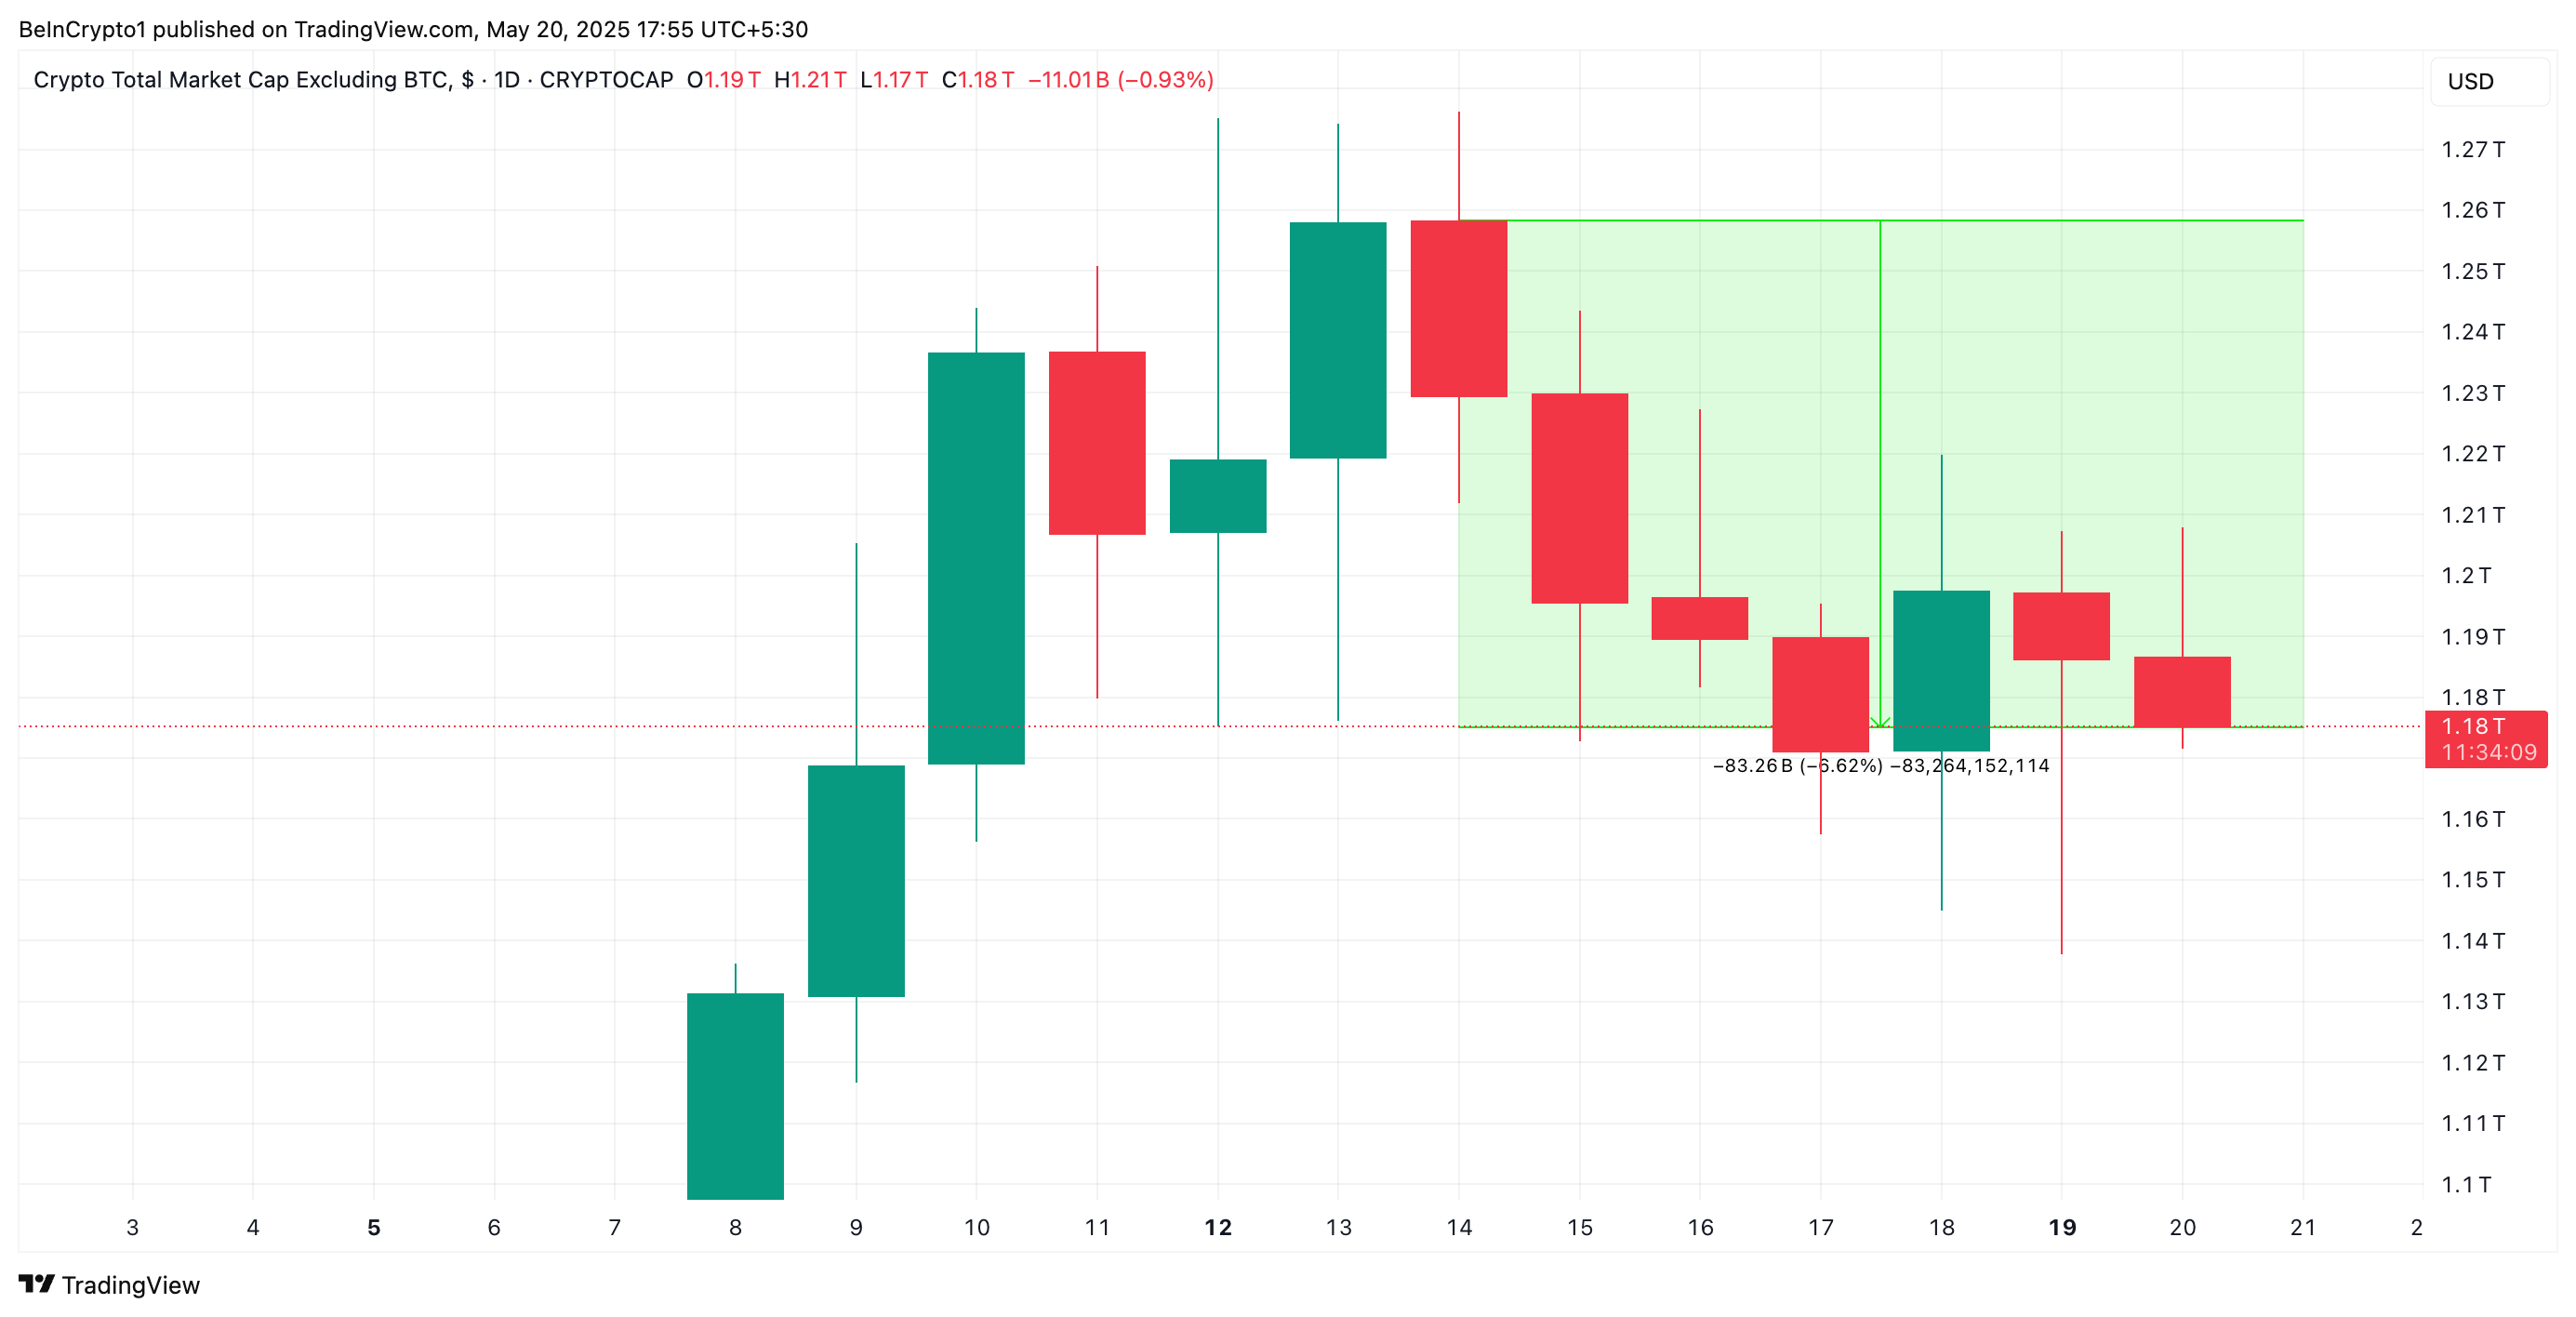
Interestingly, TOTAL2, which measures the market capitalization of all cryptocurrencies except BTC, has been declining since May 14th. Currently at $1.18 trillion, it decreased by $83 billion last week.
This difference suggests that market participants are increasingly reallocating capital to BTC rather than altcoins.
The current trend indicates that traders are focusing more on BTC's resilience, particularly attempting to stabilize the price around the $105,000 level.
BTC DMI Shows Strong Buying Pressure
On the daily chart, BTC's Directional Movement Index (DMI) confirms the market's bullish pressure. Currently, the positive directional index (+DI, blue) is above the negative directional index (-DI, orange).
When an asset's DMI is set up this way, it indicates that bullish momentum is stronger than bearish momentum. This suggests continued upward trend and buying pressure in the BTC market.
If this trend continues, the price could break through the $107,048 resistance and rise to the all-time high of $109,588.
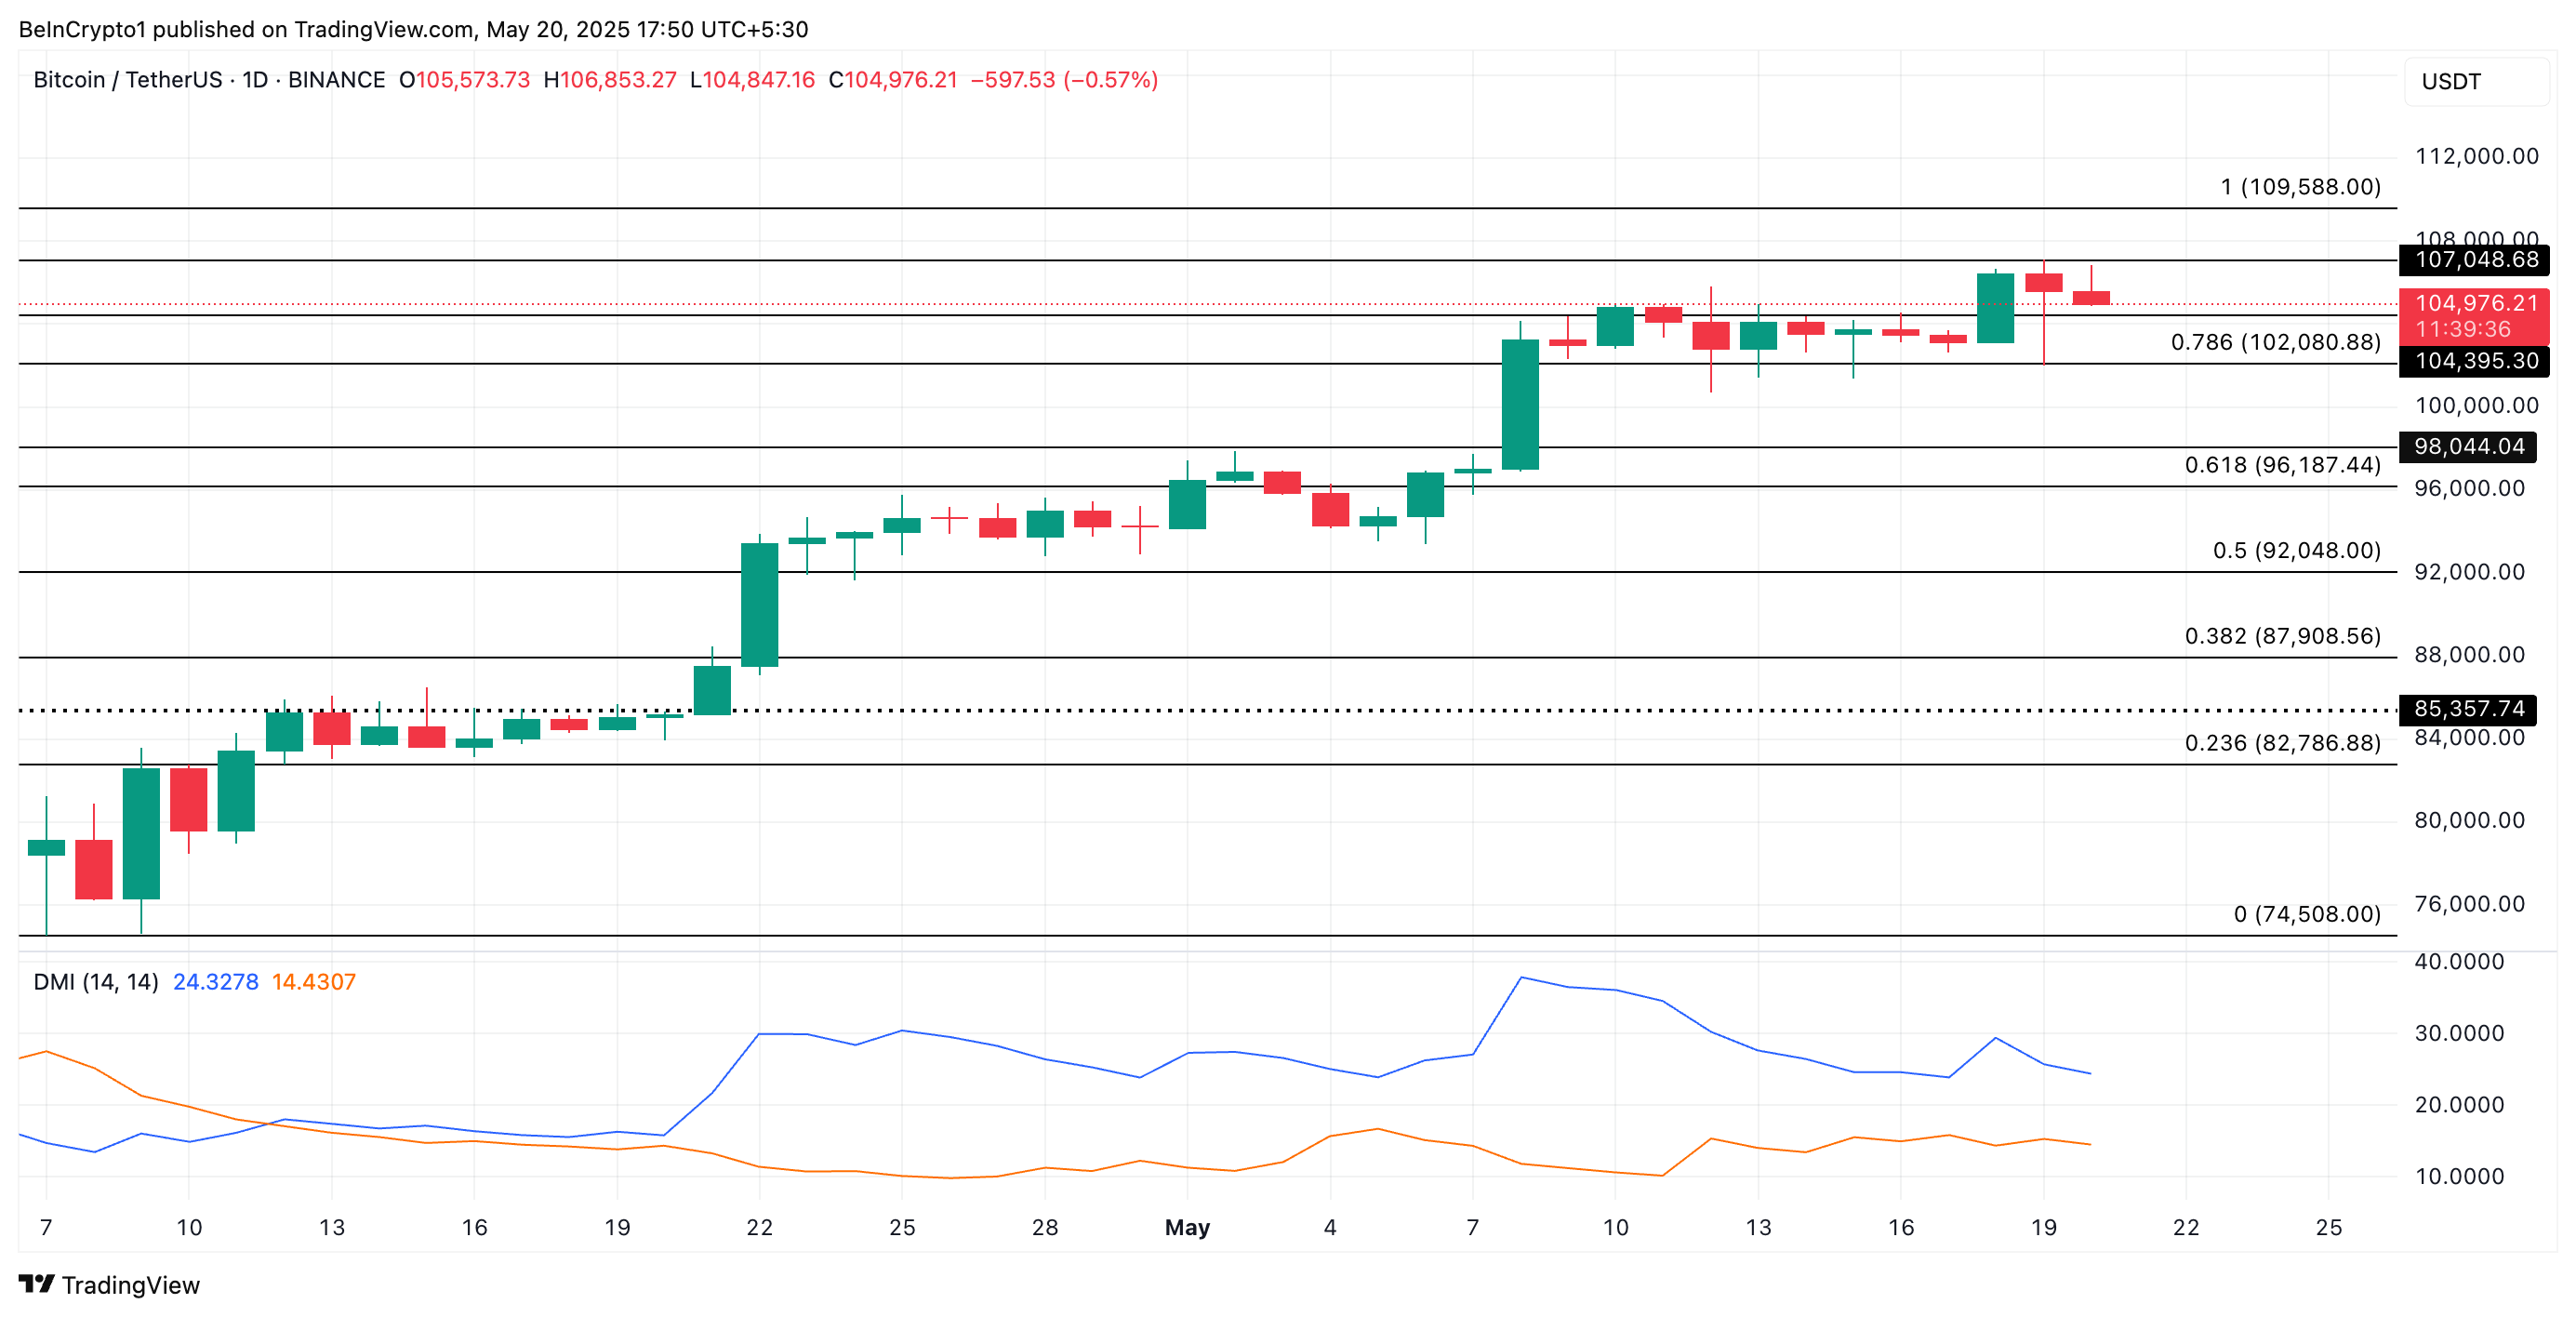
Conversely, if selling pressure intensifies, BTC's price could drop to $102,080.


