

- When new short-term participants in the market gradually transition from losses to profits, it typically signifies a recovery of overall confidence. Such changes are often accompanied by market trend reversals and represent a key inflection point in market sentiment.
Indicator Trigger Point:
- Once the average cost of short-term holders exceeds their holding cost, it indicates that these funds are experiencing a profit and loss reversal. Their profit sentiment will bring stronger buying momentum, driving prices to continuously break through previous trading ranges until the upward momentum is neutralized by long-term investors' selling pressure. Therefore, when the "short-term holding cost line" crosses above the "cost line", it often means the market is warming up, and a trend reversal signal has appeared on the right side of the chart.
Currently not triggered, but the yellow line has started converging towards the blue line. Based on the curve convergence, this remains a left-side entry approach.
The pricing interval based on MVRV ratio's extreme deviation can also be seen as different thicknesses of glass. When overall break-even is reached, participants become unwilling to exit with further losses, and downward momentum weakens. This indicates that most market participants still remain bullish on Bitcoin's long-term prospects and are not swayed by short-term fluctuations. In a "bear market expectation" dominated market atmosphere, price breaking below key cost lines would typically trigger a series of panic selling, unlike the current rapid stabilization. Combining the current profit and loss landscape of long and short-term holders and the weakening downward momentum, we can infer that the market is very close to a local bottom, with strong left-side entry value at this stage.
The second perspective focuses on the supply-demand relationship between stablecoins and Bitcoin, namely BTC-SSR.
BTC market value divided by total stablecoin market value represents Bitcoin's ability to capture liquidity from the entire stablecoin pool. The stronger this ability, the higher the probability of price increases, and vice versa.
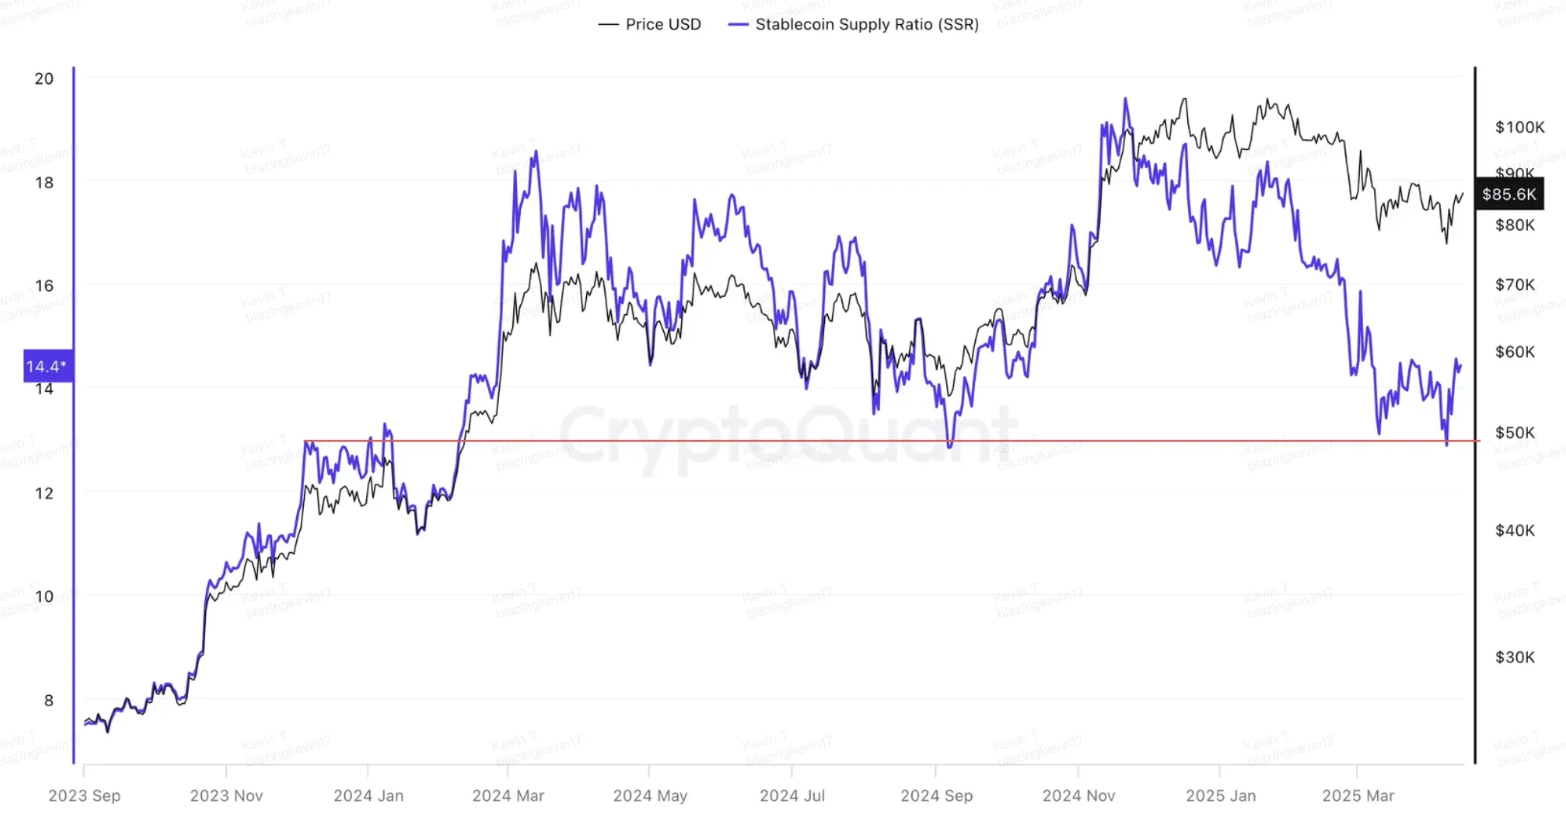
From the BTC-SSR trend, since the market launch in late 2023, whenever Bitcoin and stablecoins show divergence, stablecoins are highly likely to flow into Bitcoin, pulling BTC-SSR back to the interval. This pattern appeared twice at high points on March 13, 2024, and November 21, 2025, corresponding to prices of 73k and 98k. Four local low points occurred on August 5 and September 6 last year, and March 10 and April 8 this year, all at local lows. Further observing stablecoin and Bitcoin market values, whenever they diverge, BTC-SSR quickly drops until reaching the proportion from the 23-year market launch, indicating accumulating momentum for stablecoins flowing into Bitcoin. Once the demand zone is reached, energy will be immediately released. Currently, stablecoin market value continues accelerating, with constantly inflowing stablecoins likely to drive Bitcoin market value. The premise remains that the bull market exists and the trend has not disappeared.
The third perspective is the dual anchor effect formed by high and low chip concentration areas
[The translation continues in the same professional and precise manner for the rest of the text.]Intense selling has driven the price back to the demand zone, and it is highly unlikely that Trump will release more negative signals on tariffs. Tariffs for most countries are raised high but fall gently, with limited destructive power. The 10% reciprocal tariff has already achieved its purpose. Trump cannot afford further U.S. debt sell-offs and can only operate within a range that does not cause debt sell-off panic. The destructive power is further controlled, and the buff given to the supply side by tariffs will start to lose effect, with downward momentum beginning to decay. Therefore, market sentiment is gradually easing, short-term holders will gradually profit, long-term holders' selling pressure has not yet arrived, and there is a possibility of a large amount of stablecoins flowing into Bitcoin. This supports the current rebound potentially strengthening into a reversal, and the attractiveness of entering from the left side is increasing.
Second Perspective: Current Rebound is the Second Distribution after Accumulation
This view considers the current stage as a downward continuation towards a long-term bear market. Macro discussion reasons include tariff-induced inflation acceleration, heading towards stagflation, and potentially accelerating recession. However, the core of this view is that the U.S. stock market has entered a technical bear market, and its continued decline is inevitable, with Bitcoin unable to remain unaffected and lacking independence, likely to be dragged down by U.S. stocks. Therefore, this shares the basis for determining that the U.S. stock market has entered a technical bear market.
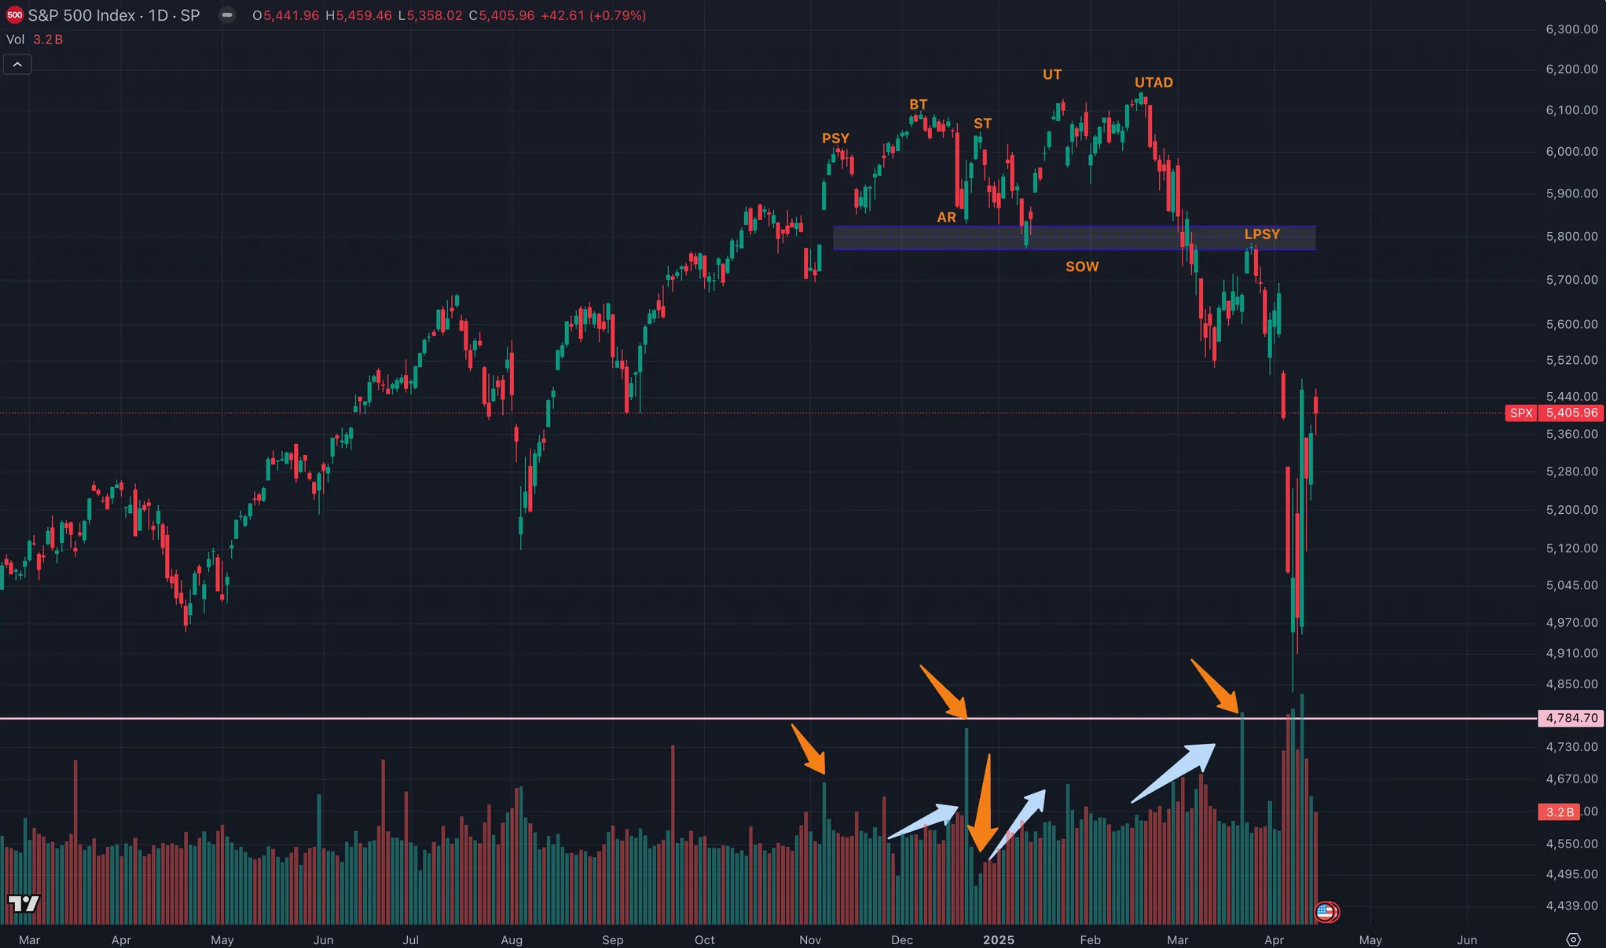
The second perspective believes that the U.S. stock market's trend in the past few months completely matches the Wyckoff distribution phase. The author explains this view from price and corresponding trading volume, i.e., volume-price behavior. The yellow arrows indicate the need to pay attention to single-day volume patterns; the light blue shoulder points indicate the need to focus on volume patterns over a period.
On November 6th, the price began to rise sharply, with trading volume expanding and price difference increasing, signaling that the stage's high point is approaching. This is the PSY - initial supply point.
From late November to early December is the BC buying climax: also known as the buying dense area. Trading volume and price difference significantly expanded, with selling power reaching its peak. Near the market top, the public's eager large-scale buying was satisfied by the main force's massive sell orders.
On December 18th, after the buying climax, AR naturally fell back, with buying almost exhausted, but selling continuing, thus causing a natural pullback. The lowest point of the natural pullback helps define the market bottom of the distribution trading range.
The volume buying on December 20th was the first accumulation, i.e., ST second test: after the natural pullback, the price rose again near the buying climax area to test the supply and demand conditions near the buying climax area. When the price approaches the resistance zone of the buying climax, trading volume should decrease, and price difference should narrow, indicating that supply will exceed demand, confirming the price top.
From late December to early January, a SOW weak signal appeared: weak signals usually occur at the end of distribution, with price dropping to the bottom of the distribution range or slightly breaking through it, often accompanied by increased trading volume and expanded price difference. The weak signal means that supply controls the market.
From January 13th to January 23rd is the UT upthrust and pullback: the purpose of the upthrust and pullback is to lure the last wave of buyers to go long, while also breaking the stop-loss set by early short sellers. The upthrust and pullback is a price stopping behavior, but it gives the public the feeling that the price is about to break through the range's resistance, as the main force does not want the public to see that the price is about to fall.
On February 19th, a UTAD upthrust and pullback appeared after distribution: it is the main force's final test of the demand generated after the price breaks above the range's resistance line.
From February 19th to early March: demand is falsified, with accelerated escape as trading volume expands.
On March 25th, the LPSY final supply point appeared: even with volume buying, after SOW tested the ice line's support strength, the price rebound was weak, with price difference narrowing, indicating that price increase is difficult. The reason for difficult price increase might be that demand has been exhausted or supply controls the market. The final supply point is the main force's last distribution wave before a rapid price drop.
The U.S. stock market's price pattern and corresponding trading volume expansion or contraction completely match the Wyckoff distribution theory. This proves that the U.S. stock market has completed the bull market's final sprint, with distribution finished. Next, finding the LPS (last point of support) is needed to realize bear-to-bull transformation; before that, all are bull traps, and one should go short at highs.
The difference between the two mainstream market perspectives can also be seen as expectations for the U.S. stock market and Bitcoin's potential decoupling: whether Bitcoin can remain unaffected if U.S. stocks cannot stop falling; or whether U.S. stocks can bottom here, with Bitcoin rebounding first.
Market divergence is further intensifying. Which perspective do you agree with?


