Original Title: Where Are We In The Bitcoin Cycle?
Author: BITCOIN MAGAZINE PRO
Translated by: Tim, PANews
Bitcoin did not have the explosive start in early 2025 that many expected. After peaking and breaking through the $100,000 mark, the price dropped significantly, leading investors and analysts to question: At what stage of the halving cycle is Bitcoin currently? In this article, we will cut through market noise and delve into a series of key on-chain indicators and macroeconomic signals to assess whether the Bitcoin bull market still has sustainability, or if it is about to face a deeper correction.
Healthy Correction or Bull Market Termination?
An ideal entry point is the MVRV-Z indicator. This long-standing valuation metric measures asset conditions by comparing the market value to realized value of cryptocurrency. When this value dropped from its peak of 3.36 to around 1.43, it coincided with Bitcoin's price falling from near $100,000 to a staged low point of $75,000. Intuitively, this 30% price pullback is indeed quite severe.
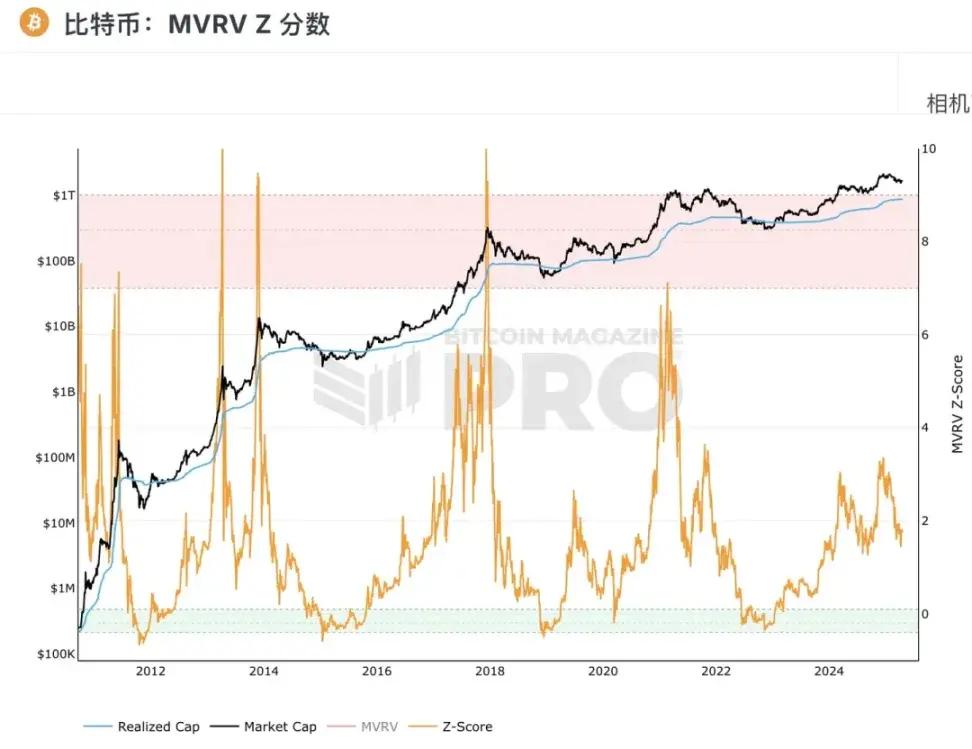
Figure 1: Recently, the MVRV Z-Score has rebounded from the 2025 low of 1.43
Historically, the current level of the MVRV-Z indicator often marks a local bottom rather than a top. In past cycles such as 2017 and 2021, the market experienced similar corrections, after which BTC prices resumed an upward trend. In short, although this decline has shaken investor confidence, it is essentially consistent with historical corrections in the bull market cycle.
Tracking Smart Money Movement
Another key indicator is the Value Days Destroyed (VDD) multiple. This indicator weighs Bitcoin's on-chain transfer speed based on the holding time before trading. When this multiple spikes, it usually means experienced holders are taking profits; if it remains low for an extended period, it may indicate the market is in an accumulation phase.
Currently, this indicator is deep in the "green zone", with levels similar to the late bear market or early recovery stage. Due to BTC's sharp reversal from above $100,000, we may be witnessing the end of a profit-taking wave, while some long-term accumulation behaviors have become increasingly apparent, suggesting participants are positioning themselves for future price increases.
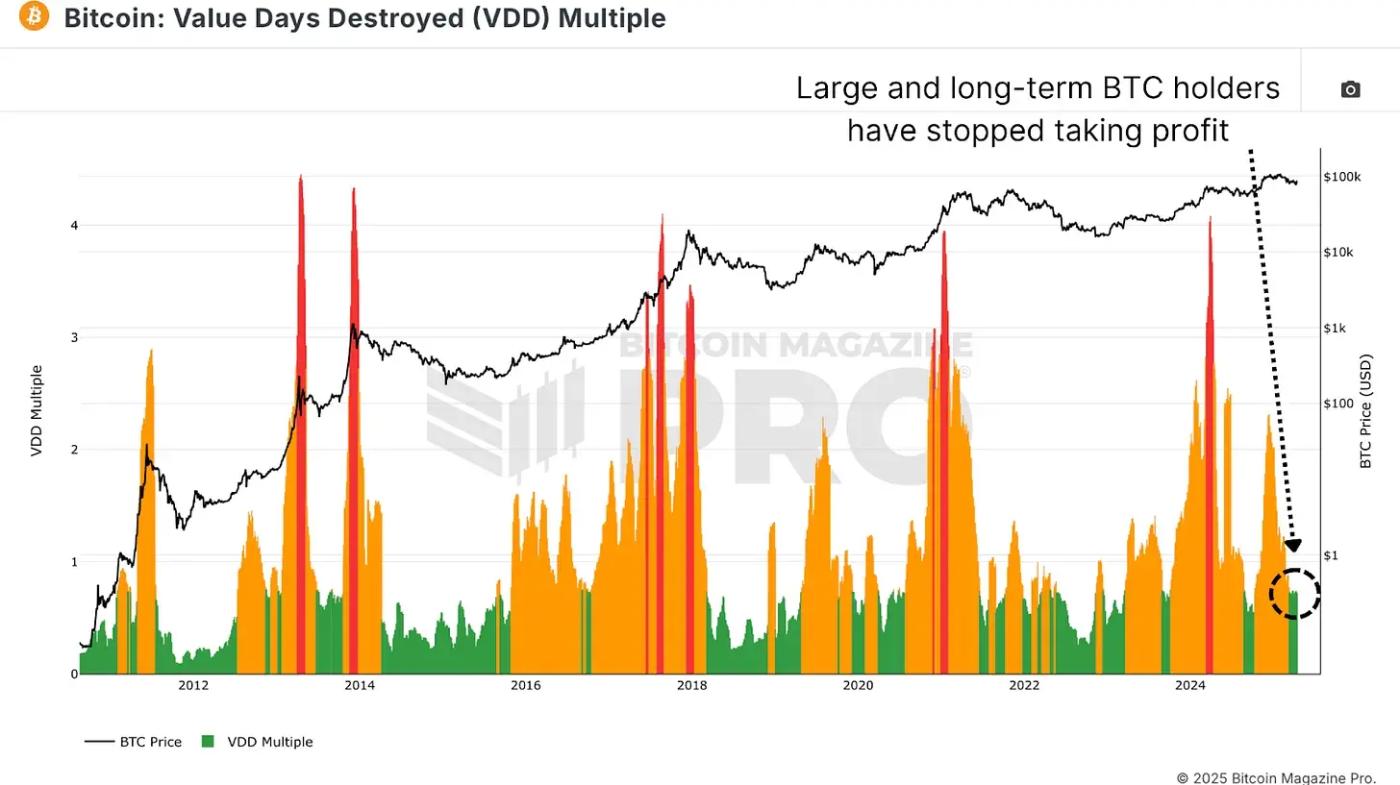
Figure 2: Current VDD multiple indicates long-term holders are in an accumulation phase
One of the most insightful on-chain indicators is the "Bitcoin Cycle Capital Flow Chart", which segments realized capital based on coin age, isolating different groups such as new entrants (holding time <1 month) and medium-term holders (1-2 years). The red band (new entrants) sharply rose near the $106,000 historical high, indicating a large number of FOMO-driven panic buying at the market top. Since then, the activity of this group has significantly cooled down, falling to levels consistent with the early to mid-bull market.
In contrast, the group holding tokens for 1-2 years (typically accumulators with macro insights) has resumed an accumulation stance. This inverse correlation reveals the core logic of market operation: when long-term token holders accumulate at the bottom, new investors are often experiencing panic selling or choosing to exit. This alternating capital flow pattern highly matches the "absorption-distribution" pattern in the complete bull market cycle of 2020-2021, reproducing typical characteristics of historical cycles.

Figure 3: Bitcoin Cycle Capital Flow Chart shows BTC flowing back to more experienced holders
Where Are We Now?
From a macro perspective, we divide the Bitcoin market cycle into three key stages:
- Bear Market Stage: Deep correction (70-90%)
- Recovery Stage: Reclaiming historical highs
- Bull Market Growth Stage: Parabolic rise after breaking previous highs
Bear markets in 2015 and 2018 lasted about 13-14 months. Our recent bear market cycle also lasted 14 months. The market recovery stage in historical cycles typically requires 23 to 26 months, and we are currently within this typical recovery time window.

Figure 4: Predicting potential bull market peak using historical cycle trends
However, this bull market stage is somewhat abnormal. Bitcoin did not immediately surge after breaking the historical high but instead experienced a correction. This may mean the market is constructing a higher low point before entering a steeper upward channel in the exponential growth stage. Referencing the average duration of 9 and 11-month exponential stages in past cycles, assuming the bull market continues, we estimate the potential top of this cycle could appear around September 2025.
Macro Risks
Despite encouraging on-chain data, macro-adverse factors still exist. Analysis of the correlation chart between the S&P 500 and Bitcoin shows that Bitcoin remains highly correlated with the US stock market. As concerns about potential global recession intensify, continued weakness in traditional markets may affect Bitcoin's ability to rebound in the short term.

Figure 5: Bitcoin's correlation with US stocks
Conclusion
As we've seen in our analysis, key on-chain indicators such as MVRV Z-value, Value Days Destroyed, and Bitcoin Cycle Capital Flow demonstrate that the market is showing a healthy development in line with cycle patterns and indicates continuous accumulation by long-term holders. However, significant macroeconomic uncertainties still exist, which are key risks to be closely monitored.
This cycle is slower and more volatile than previous cycles but has not broken historical structural patterns. Bitcoin seems poised to rise again, and if traditional markets do not further deteriorate, it may reach a new peak in the third or fourth quarter.