avatar
Murphy
64,409 Twitter followers
Follow
17年老韭菜;研究链上数据和宏观情绪相结合,构建自己的交易思维。保持谨慎乐观!| 近3亿用户的共同选择就在币安:https://t.co/5pQWuny9gU | #OKX web3入口一个就够 https://t.co/YwY7pIgKzB
Posts
Signal Clone Analysis
avatar
Murphy
At this point, it’s clear that my recent attempt to catch the bottom and play the bounce hasn’t worked out—just goes to show how tough it is to go against the trend in a down market. But after spending so much time in crypto, it’s hard to resist taking a long position. In theory, you buy when BRS hits 100 and sell when it drops back to 0—that’s a textbook swing trade. I’ve backtested historical BRS signals, and during bull-bear transitions, the success rate for catching rebounds is around 70%. Of course, there are uncertainties. For example (I’ve adjusted BTC price to the blue line for clarity): (Figure 1) Like at point 2 in Figure 1, BRS just briefly touched 100 before dropping, while BTC was consolidating. This scenario usually ends in failure. Because when BRS hits 100 again, BTC starts dumping. If you buy at the first touch and wait for BRS to drop to 0 to sell, you’re in the red. What we want to see is “BRS staying at 100 for a while”—letting the panic fully play out. Then, as BRS heads toward zero, BTC typically rebounds. But here’s another issue: While BRS is stuck at 100, BTC tends to chop up and down. So when BRS first touches 100, it’s not always the absolute bottom. Like points 1/3/4 in Figure 1, there’s always some drawdown. I’ve backtested the last 10 years. On average, drawdowns are around -13%. The worst case was -25% (and that happened only once). (Figure 2) Back to the present, BRS has already held at 100 for a while—not a “sharp peak.” So statistically, there’s a 70% chance this bounce works. We noted that when BRS hit 100 this time, BTC was at $75,992. Based on historical backtests, a drawdown of around -13%, or $65,000-$66,000, is within the normal range. So here’s the real question: If you bought at $75K and BTC drops below the $70K psychological level, should you keep buying to average down, or cut losses and wait for a new setup? Sorry, I can’t give financial advice. Everyone’s capital, risk tolerance, time, and position management are different. But remember: your strategy shouldn’t keep you up at night, stressed and worried! As long as you survive the bear, you’ll have plenty of chances to thrive… twitter.com/Murphychen888/stat...
BTC
8.09%
avatar
Murphy
Slow grind down, but not a collapse — Reconstructing BTC's cost basis under panic through URPD 
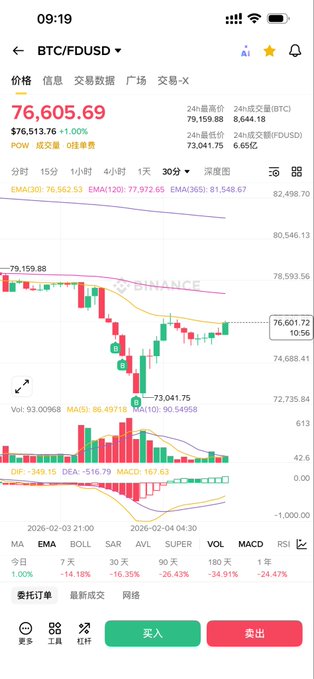
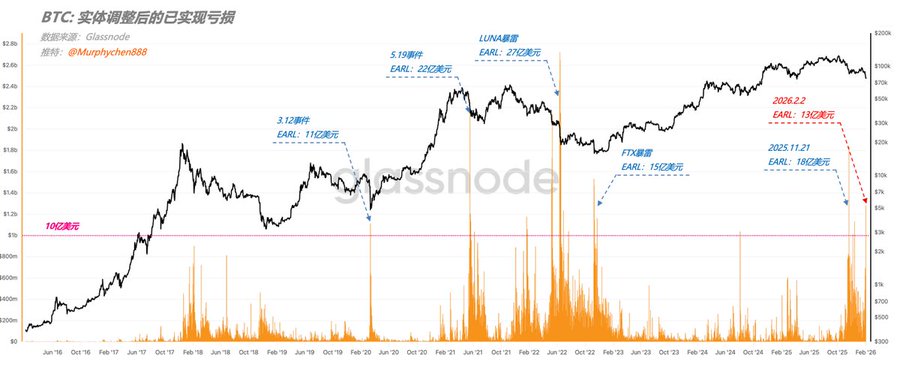
On Feb 4, BTC dropped from the Jan 15 high of $97,000 to $73,000. The speed and depth of this dump instantly crushed the optimism that thought $80k would hold. Let’s be real, if you say there’s no panic, you’re lying. So, it’s worth reviewing what happened to BTC’s cost basis during this period and what key signals are hidden beneath the surface. 
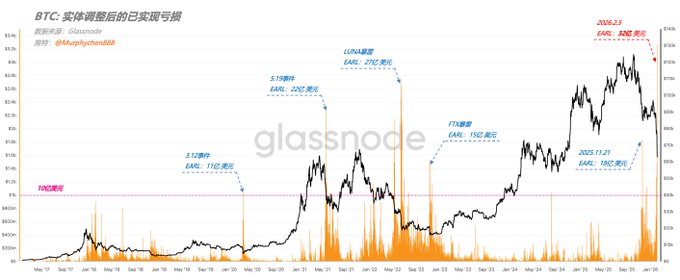
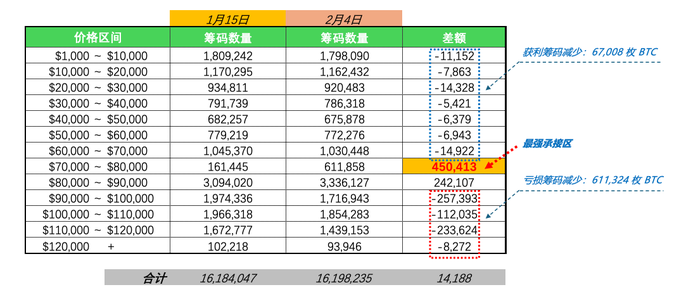
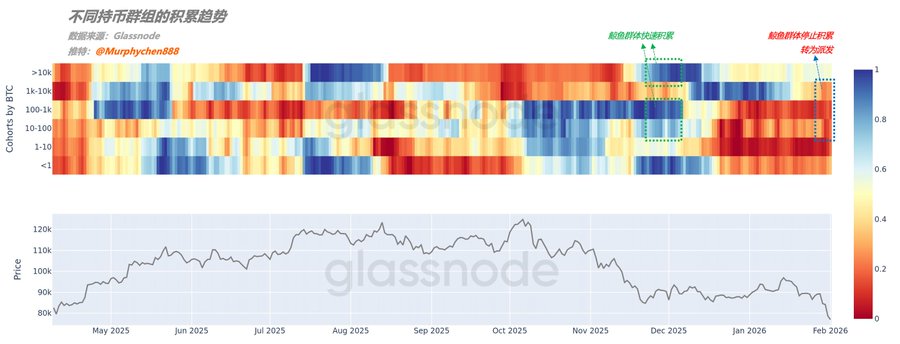
To make things easier, I pulled the full URPD data and charted it by $10,000 intervals. This lets us clearly track how coins moved and gauge the current market sentiment and behavior. (See Chart 1) From Jan 15 to Feb 4, the number of profitable coins below the price dropped by 67,008 BTC (9.7% of the total decrease), while the underwater coins above the price dropped by 611,324 BTC (88% of the total decrease). What does this mean? Basically, long-term holders with unrealized gains are selling less and less as prices fall. Either they think there’s no point in taking profit here, or they just DGAF about price and hold long-term. Bottom line: the lower we go, the less these guys sell. The main selling pressure comes from bagholders up top. Over 600k BTC got flushed out in just 20 days — that’s how intense the panic-driven capitulation has been. But on the flip side, we’re seeing massive bids in the $80k-$90k and $70k-$80k zones. Especially the latter, with net buys of 450,413 BTC — almost double the previous range. This shows there’s big money lurking, stepping in hard with real conviction — “You dump, I buy. The lower it goes, the more I scoop.” That’s what makes this cycle fundamentally different from previous ones. Even if the 4-year cycle theory hasn’t been disproven, bulls are defending every drop. 100k, 90k, 80k, 70k… the cost basis is shifting lower in steps, not falling off a cliff. Lots of people are calling for this cycle’s bear bottom at $50k or even $30k. I’m not so sure. What I do believe is: once bears squeeze bulls to the absolute limit and supply dries up, a full-on bull counterattack is inevitable. --------------------------------------------- I’ll leave you with a question to chew on: On the chart, the total coin count was 16,184,047 on Jan 15, 2026, and 16,198,235 on Feb 4 — a difference of 14,188 BTC. Where did it come from? What does it mean? Drop your thoughts in the comments and let’s discuss! --------------------------------------------- This is for learning and discussion only — NOT investment advice! twitter.com/Murphychen888/stat...
BTC
8.09%
avatar
Murphy
02-03
Panic selling in full swing! Yesterday, BTC’s on-chain Entity-Adjusted Realized Loss (EARL)—which filters out internal transfers between addresses of the same entity—hit a massive $1.3 billion. While that’s still much less than the $1.8 billion EARL seen on Nov 21, 2025, when BTC crashed to $85K, it’s still a rare event in the past decade for daily EARL to break above $1 billion. (Pic 1) Only in a bear market do we see this much weak-handed capitulation. But here’s the silver lining: panic selling can actually give BTC some much-needed breathing room during a downtrend. With selling pressure easing, BTC has a shot at finding short-term stability, which naturally fuels expectations for a relief bounce. On top of that, BTC’s supply concentration has dropped from a peak of 16% on Jan 28 to just 8.7% yesterday. This means the risk of sharp price swings triggered by overly concentrated holdings is decreasing. (Pic 2) Of course, there are plenty of factors that can amplify volatility—like leveraged liquidations, options short gamma, or poor market liquidity—and supply concentration is just one of them. (Just highlighting this specific factor here, not saying others don’t matter.) Less volatility and flushed-out weak hands both set the stage for BTC to stabilize and possibly bounce in the short term. But whether that bounce is strong or weak is another story—it all comes down to demand and momentum. ----------------------------------------------- For learning and discussion only. Not financial advice! twitter.com/Murphychen888/stat...
BTC
8.09%
loading indicator
Loading..