I. Key Tracking Indicators
💡Monday's Key Summary : The new week begins with the macro liquidity environment continuing the tight trend from last week. The most crucial change is the further decline in bank reserve requirements to around 2.83T . Coupled with high TGA liquidity absorption and a depletion of RRP reserves, the overall structure remains very tight.
🧮 II. Scoring according to the rules
Rate today according to your rules:
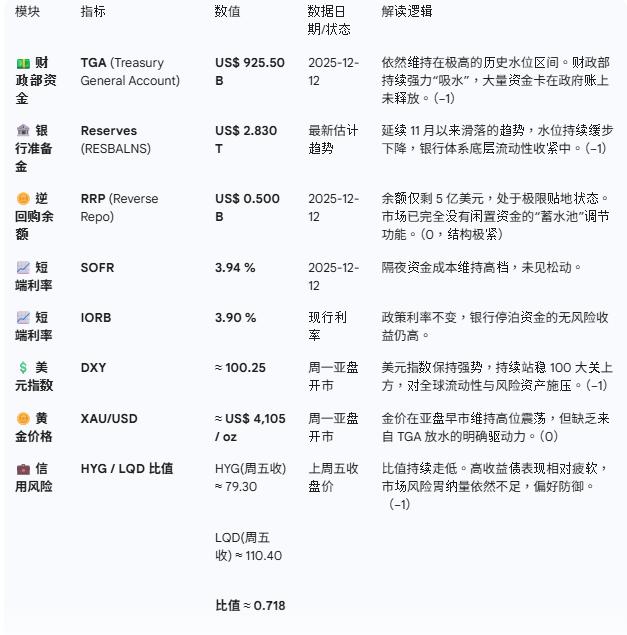
TGA maintains extremely high water absorption → pumping → -1
TGA remains firmly above 900 billion, continuing to drain liquidity from the market.
👉Score: −1
Reserve requirements trend significantly downward → tightening → -1
The trend remains slowly downward, and the water level continues to drop.
👉Score: −1
RRP drops by more than $100 in one week → liquidity injection → +1
With only about $500 million remaining, there is no room for further release.
👉Score: 0
SOFR − IORB > 0.05% → Tight Funding → −1
3.94% - 3.90% = 0.04%. The interest rate spread has not reached the stress threshold.
👉Score: 0
DXY strongly defends the 100 mark → Tightening environment → -1
The DXY has stabilized above 100.25, establishing a strong dollar environment.
👉Score: −1
Gold rose +1% and TGA declined → monetary easing → +1
The condition is not met.
👉Score: 0
A declining/sluggish HYG/LQD ratio indicates credit tightening, which could lead to a decrease of 1.
The ratio of approximately 0.718 indicates that the market is unwilling to take on credit risk.
👉Score: −1
👉Today 's total score calculation : -1 (TGA) + -1 (Reserves) + 0 (RRP) + 0 (Interest Rate Spread) + -1 (DXY) + 0 (Golden Combination) + -1 (Credit Ratio)
✅Total score = -4
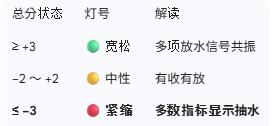
👉Today 's overall assessment: 🔴 Tight
IV. Monday Morning Interpretation
At the start of this week, the liquidity dashboard is still flashing a red light.
The current market environment is very clearly structured and shows a trend of continuous contraction:
The pump is running at full capacity: the Treasury Department (TGA) has more than $925 billion in cash in its accounts, making it the largest source of austerity in the market right now.
The water level continues to decline: The slow outflow of bank reserves is the most worrying trend, representing a decrease in the "basic water level" at the bottom of the financial system.
The buffer has been emptied: RRPs (reverse repurchase agreements) are almost completely depleted (only $500 million remains). This means the market has lost its "backup reservoir" for dealing with sudden liquidity shocks, making the system more vulnerable.
Conclusion: Under the triple pressures of a strong dollar, massive liquidity drain from TGA (Treasury General Exchange) transactions, and continuous reserve outflows, the current macroeconomic environment is extremely unfavorable for the sustained rise of risky assets. The market is currently operating in a state of "liquidity shortage" and "lack of buffer."