Zcash price has seen a massive surge during this cycle, rising over 700% in the last three months, followed by a reasonable period of correction. After a strong rally last week, the price is now showing signs of correction, leading many to wonder whether the upward momentum has slowed or is simply pausing to regain momentum.
Although short-term price movements are quite volatile, on-chain data and volume suggest that buyers are still quietly in control of the market. The next development depends on whether Zcash can transition from a sideways trend to a further uptrend.
Buyers remain in control of the trend despite the decrease in volume.
Currently, Zcash is trading inside a narrowing triangle pattern, reflecting short-term indecision between buyers and sellers, rather than a sign of genuine weakness. Importantly, the price remains above the uptrend line that led this rally. As long as this structure holds, the overall outlook remains positive.
The behavior of volume is also very important. If you use Wyckoff-style color analysis, the green bars represent buying-led activity, while the yellow and red bars show sellers beginning to take control.
Despite a slight decrease in buying pressure recently, green bars still dominate. Previously, after October 17th, buying volume also eased briefly, before Zcash surged by over 300%.
The decrease in volume alone is not enough to end the uptrend. As long as green bars remain dominant, the uptrend still has a strong chance of being sustained, even during corrections.
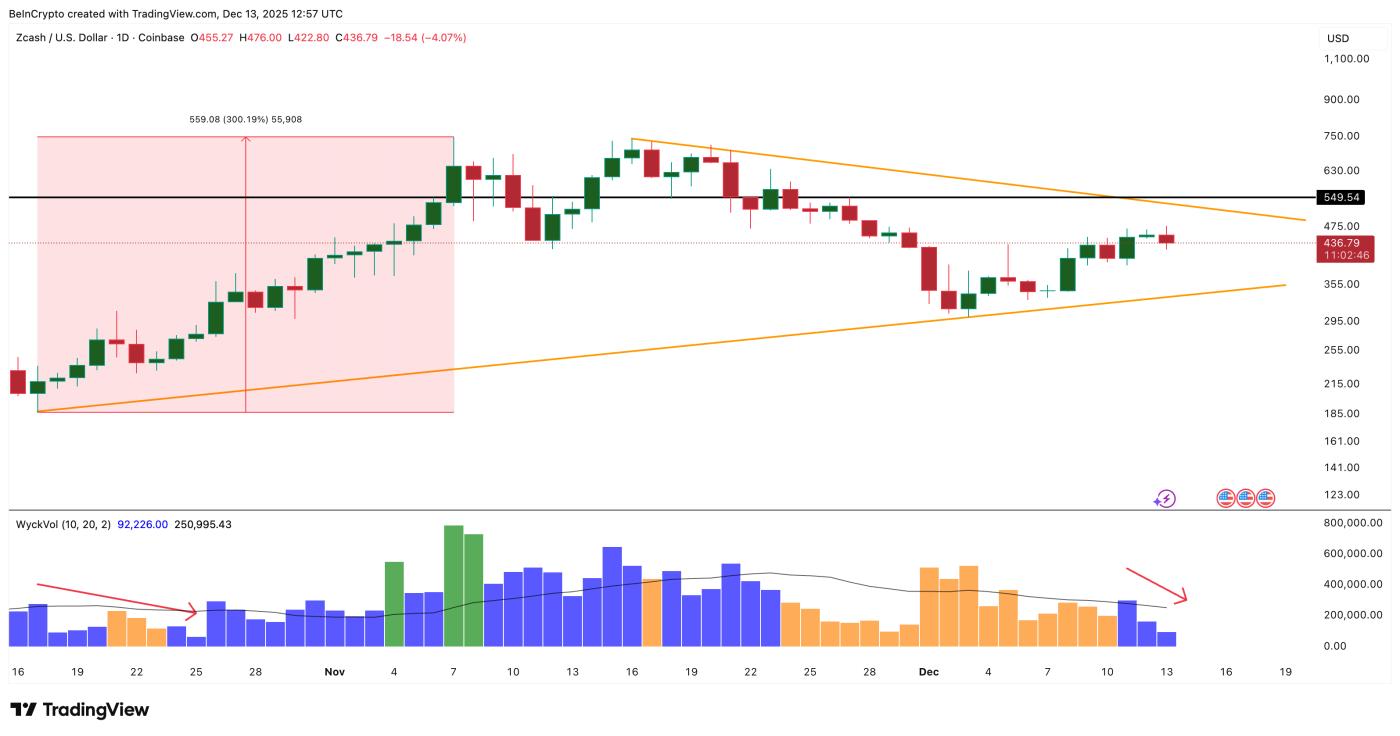 Zcash buyers hold the upper hand: TradingView
Want more Token analysis like this? Sign up for editor Harsh Notariya's daily Crypto newsletter here .
Spot flow data also reinforces this observation. Spot flow data tracks Token moving up or down exchanges.
Inflows into the exchange are usually a sign that selling is possible, while outflows imply accumulation. On December 12, 2023, Zcash recorded approximately $14.26 million in spot transactions, meaning Token were brought onto the exchange.
By December 13, 2023, the opposite trend emerged: approximately $17.34 million worth of Token were withdrawn from the exchange, indicating strong accumulation activity.
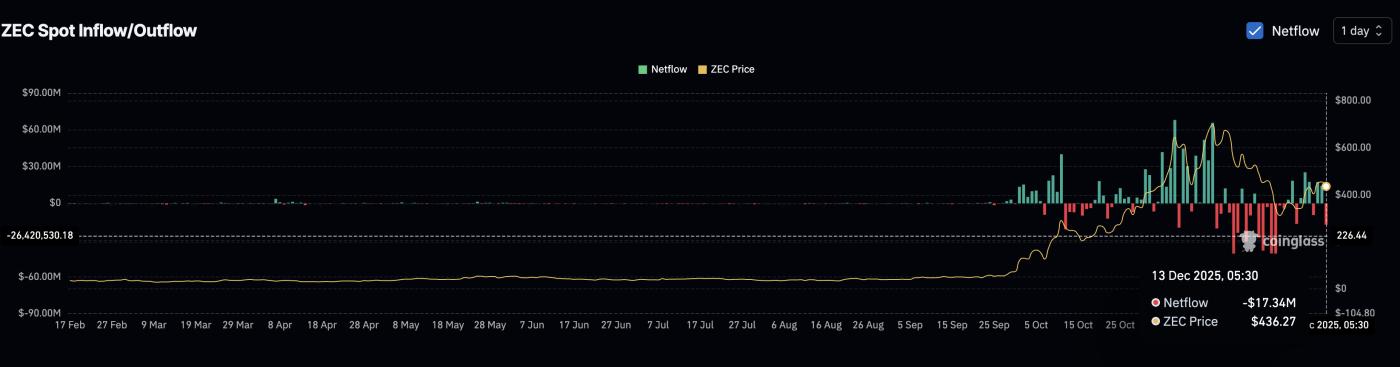 Spot buying surged: Coinglass
This shift is crucial. When Token are delisted from exchanges, short-term selling pressure decreases, often indicating that retail investors are taking advantage of corrections to accumulate rather than selling when prices surge.
Although Zcash has seen a slight decrease of about 2.5% in the last 24 hours, it is still up nearly 20% this week and over 700% in the last three months. The main trend has not been broken and is only in a sideways consolidation phase.
Zcash price levels determine the next trend.
For the uptrend to continue, the price of Zcash needs to break out of the ongoing triangle pattern. The key level to watch is $511, representing a 24% increase from the current price. If the price can close the day above this level, it would be a confirmation that buyers have regained control.
If the breakout is successful, the first upside target will be the area near $549, followed by the $733 area – where previous rallies have been halted. Higher resistance levels will be around $850 and $1,190, but reaching those levels will require strong buying pressure and a favorable overall market for price increases.
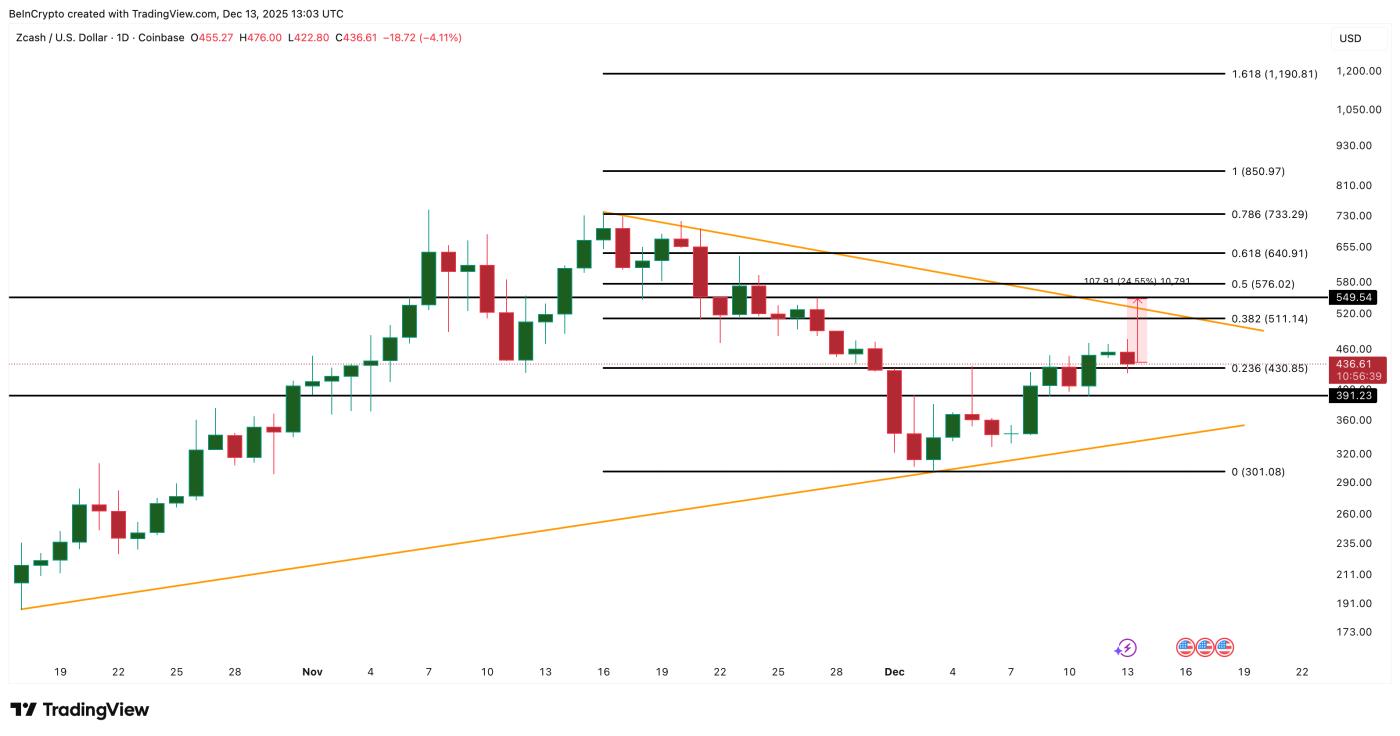 Zcash price analysis: TradingView
The risk of a downward correction remains a clear concern. If Zcash price falls below $430, the triangle structure will be broken. Strong support is located in the $391 area, and a worsening market could push the price further down to $301.