Bitcoin is holding near $112,100, up about 1% over the past week. The move from $107,200 to $112,100 shows that September started with some relief after a more than 6% drop in August. Traders have welcomed the recovery, but the bigger picture remains bearish.
Bitcoin is down about 9% over the past month, and new signals suggest that bears are not done yet. The simple question is: can Bitcoin defend $112,000, or will the trend resume?
Long-term investors are cutting back while whales return to exchanges
The first warning signs came from long-term holders. These wallets typically build confidence and rarely sell when weak. But that picture changed in mid-July.
On July 13, they held 14.72 million BTC. By early September , that number had dropped to 14.43 million BTC, a three-month low.
The roughly 290,000 BTC leaving strong hands is not a small number; this shows that even patient holders are reducing their risk or selling every time the price recovers.
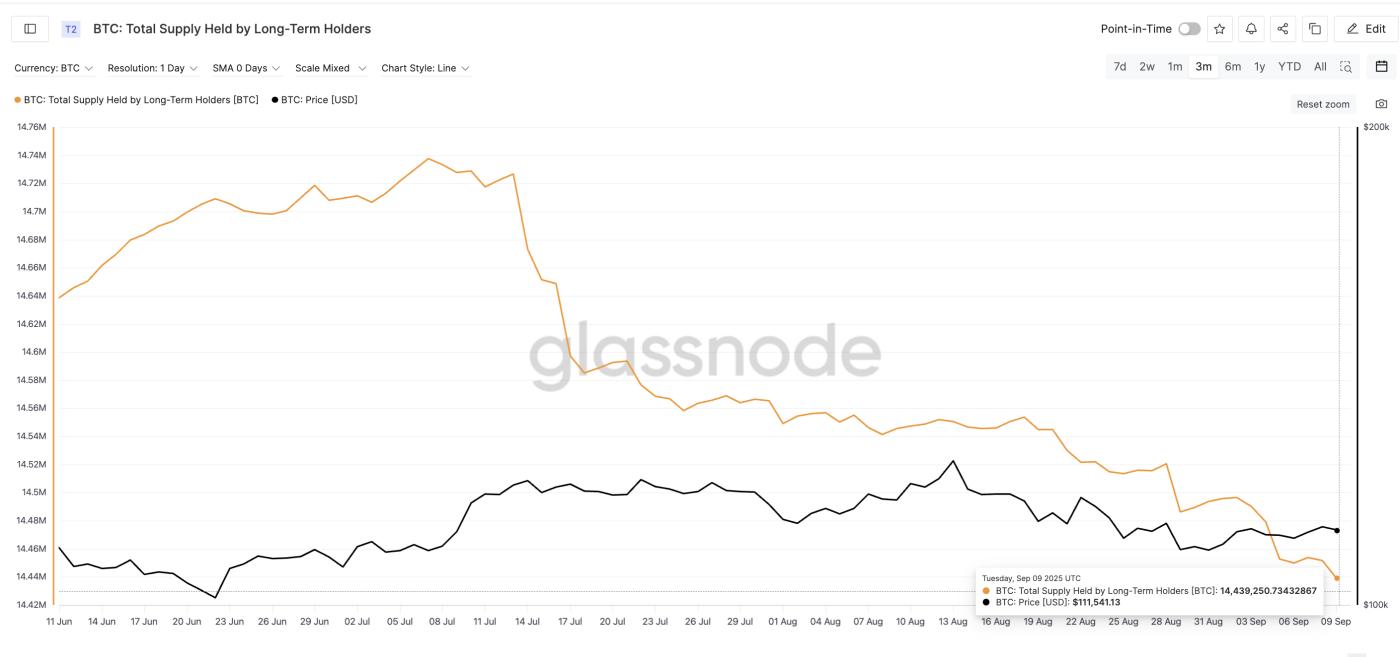 Bitcoin Longing-Term Holders Dropping Supply: Glassnode
Meanwhile, whales are back in the spotlight. The exchange whale ratio — which tracks inflows from the 10 largest wallets — has increased from 0.44 on September 5 to 0.53 at the time of writing.
The last time it hit similar levels, on August 21, Bitcoin fell from $116,900 to $108,300 over the next few days.
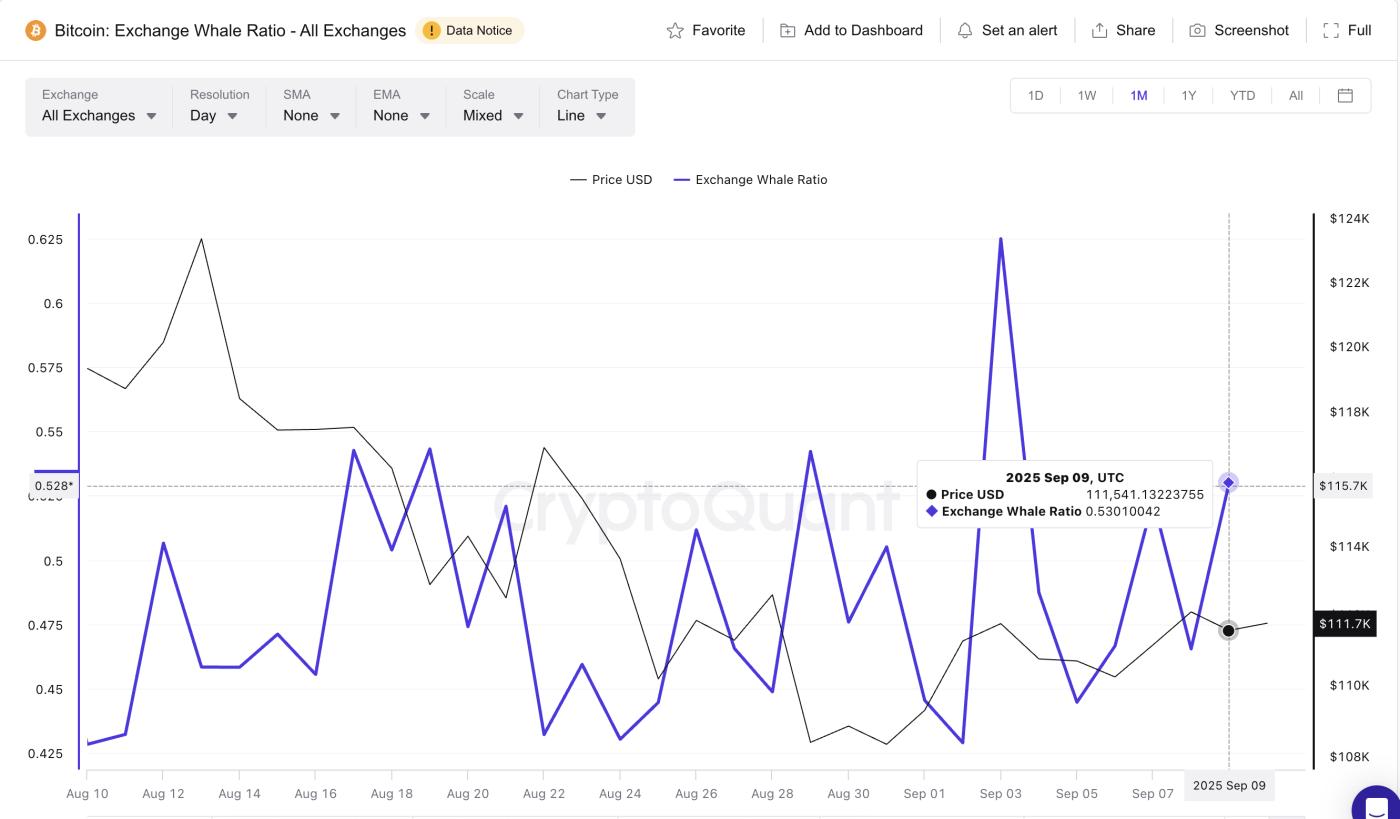 Bitcoin Whales Keep Pushing BTC To Exchanges: CryptoQuant
Want more information on Token like this? Sign up for Editor Harsh Notariya's daily Crypto Newsletter here .
The monthly whale-to-exchange ratio chart also highlights something interesting. It shows that whales are constantly moving BTC onto exchanges even at the smallest price increases. The multiple local indicator peaks can confirm this.
Combined, long-term holders cutting their holdings and whales continually pushing coins onto exchanges is not a positive mix. It signals that supply is being prepared in case of further price weakness.
Bearish Divergence on Bitcoin Price Chart Supports Argument
On chain data matches theBitcoin price chart. Between August 28 and September 8, the Bitcoin price made lower highs, while the Relative Strength Index (RSI) — a measure of buying momentum — made higher highs. This mismatch is known as a hidden bearish divergence.
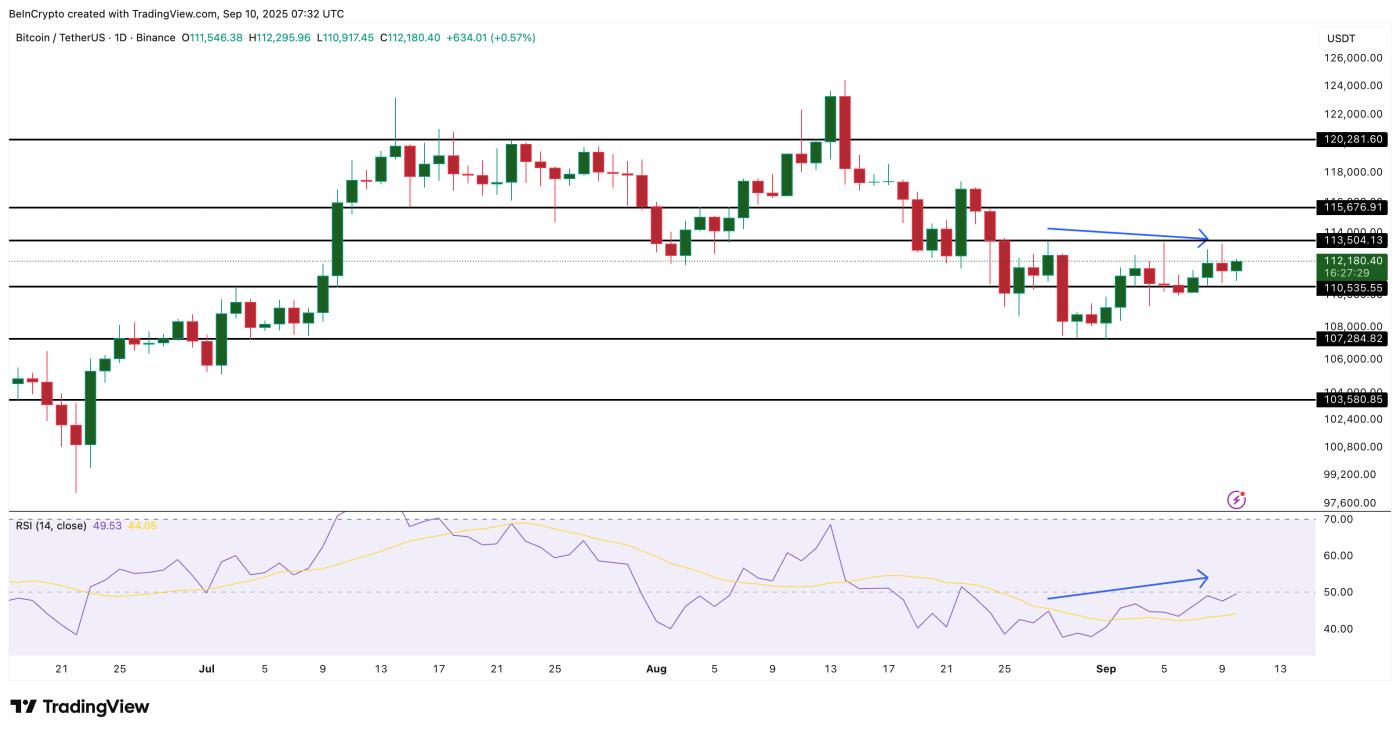 Bitcoin Price Analysis: TradingView
In other words, momentum appears to be improving, but price action is not following suit. This often sets up the next leg down.
For traders, this pattern typically warns of a continuation of a downtrend, which could mean an extension of BTC’s monthly downtrend, as it fell nearly 9% during that period.
The key level to defend for Bitcoin price is $110,500. If this level is broken, due to bearish divergence and selling pressure, the door is open for $107,200, and if pressure increases, even $103,500 could return.
Conversely, a close above $113,500 would invalidate the RSI-led decline and hand control back to the bulls.