Wall Street's crypto crush turns obsessive as ETH soars past $4,700—proof that even suits get FOMO when money printers go brrr.
The Institutional Stampede
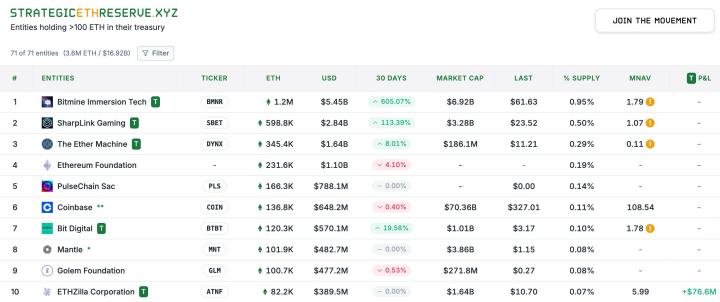
Hedge funds and asset managers are piling into ETH like it's 2021 all over again. The $4,700 breakout suggests they've finally realized bonds won't save them from inflation.
Liquidity Tsunami
With staking yields beating Treasury bills and DeFi eating traditional finance's lunch, Ethereum's rally exposes how painfully slow legacy banks are to adapt. No wonder BlackRock's suddenly 'bullish on blockchain.'
Funny how institutional conviction arrives right after retail does the heavy lifting. Welcome to the party, whales—try not to crash it this time.

Quick Take
• ETH currently trading at $4,723.84 (+3.06% in 24h) • Ethereum's RSI at 78.61 signals overbought conditions with potential pullback risk • Standard Chartered's $7,500 year-end target fuels institutional investment surge
What's Driving Ethereum Price Today?
The ETH price rally accelerated dramatically over the past 48 hours following Standard Chartered's revised year-end forecast of $7,500 for Ethereum. This bullish revision, announced on August 13th, cited improved industry engagement and rising institutional ETH holdings as key drivers.
Yesterday's surge past $4,400 was primarily fueled by increased institutional investment and the SEC's favorable stance on ETH ETFs. This institutional momentum represents a significant shift from retail-driven rallies, providing more sustainable price support for Ethereum.
The broader market context shows Ethereum's net capital change has surpassed Bitcoin's, indicating a potential altcoin season is emerging. This capital rotation from Bitcoin to ethereum suggests investors are positioning for higher risk-adjusted returns in the second-largest cryptocurrency.
Notably, Ethereum co-founder Jeffrey Wilcke's transfer of $9.2 million worth of ETH to Kraken on August 9th initially created some selling pressure, but institutional buying has easily absorbed this supply.
ETH Technical Analysis: Overbought Signals Emerge Amid Bullish Momentum
Ethereum technical analysis reveals a complex picture of extreme bullishness tempered by overbought conditions. The ETH RSI reading of 78.61 indicates Ethereum is significantly overbought on the daily timeframe, suggesting a potential short-term correction may be imminent.
However, the MACD tells a different story. Ethereum's MACD at 331.37 with a signal line at 253.68 shows strong bullish momentum remains intact. The positive MACD histogram of 77.69 confirms this upward momentum is accelerating rather than weakening.
Ethereum's position relative to its Bollinger Bands is particularly noteworthy. With a %B position of 1.0002, ETH is trading right at the upper Bollinger Band resistance level of $4,723.50. This positioning typically indicates either a strong breakout continuation or an imminent pullback to the middle band.
The moving average structure strongly supports the bullish case. ETH price sits well above all major moving averages, with the 7-day SMA at $4,401.08 providing immediate support. The golden cross formation between shorter and longer-term EMAs remains firmly in place.
Ethereum Price Levels: Key Support and Resistance
Based on Binance spot market data, critical Ethereum support levels are well-defined despite the recent rally. The immediate support sits at $3,354.28, representing a significant gap from current prices. This wide support gap indicates high volatility potential if selling pressure emerges.
ETH resistance levels are more tightly clustered around current price action. The immediate resistance matches today's 24-hour high at $4,783.85, just $60 above current levels. Breaking this level could trigger further institutional FOMO and push Ethereum toward the $5,000 psychological barrier.
Strong support for Ethereum remains at $2,373.00, though this level seems distant given current momentum. More relevant for short-term traders is the 20-day SMA support at $3,941.37, which could serve as a logical profit-taking level if the ETH RSI overbought condition triggers selling.
The daily ATR of $200.02 suggests Ethereum traders should expect significant price swings, making tight stop-losses particularly risky in the current environment.
Should You Buy ETH Now? Risk-Reward Analysis
For momentum traders, the ETH price action presents a classic overbought dilemma. While institutional buying provides strong fundamental support, the ETH RSI at 78.61 historically precedes short-term corrections in Ethereum.
Conservative traders might consider waiting for a pullback to the $4,400 level, where the 7-day SMA could provide support. This approach offers better risk-reward ratios while still participating in the broader uptrend.
Aggressive traders could use tight stops just below $4,600 to participate in a potential breakout above $4,783.85. However, position sizing should account for Ethereum's elevated volatility as measured by the current ATR.
Long-term investors benefit from the institutional narrative shift. Standard Chartered's $7,500 target implies 58% upside from current levels, while some analysts forecast $12,000 in the next cycle. Dollar-cost averaging into ETH/USDT positions could be optimal for capturing this longer-term thesis while managing short-term volatility.
Conclusion
The ETH price surge to $4,723.84 reflects genuine institutional adoption momentum, but technical indicators suggest caution for short-term traders. Ethereum's overbought RSI conditions warrant careful position management, while the broader bullish trend remains intact. The next 24-48 hours will likely determine whether Ethereum can break decisively above $4,783.85 or requires consolidation before testing $5,000. Traders should monitor volume patterns and institutional FLOW data to gauge whether this rally has sustainable legs or needs a healthy pullback to continue higher.
Image source: Shutterstock- eth price analysis
- eth price prediction


