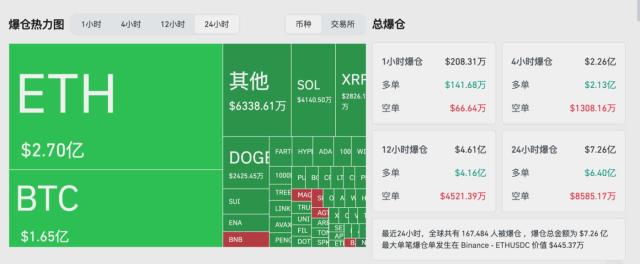
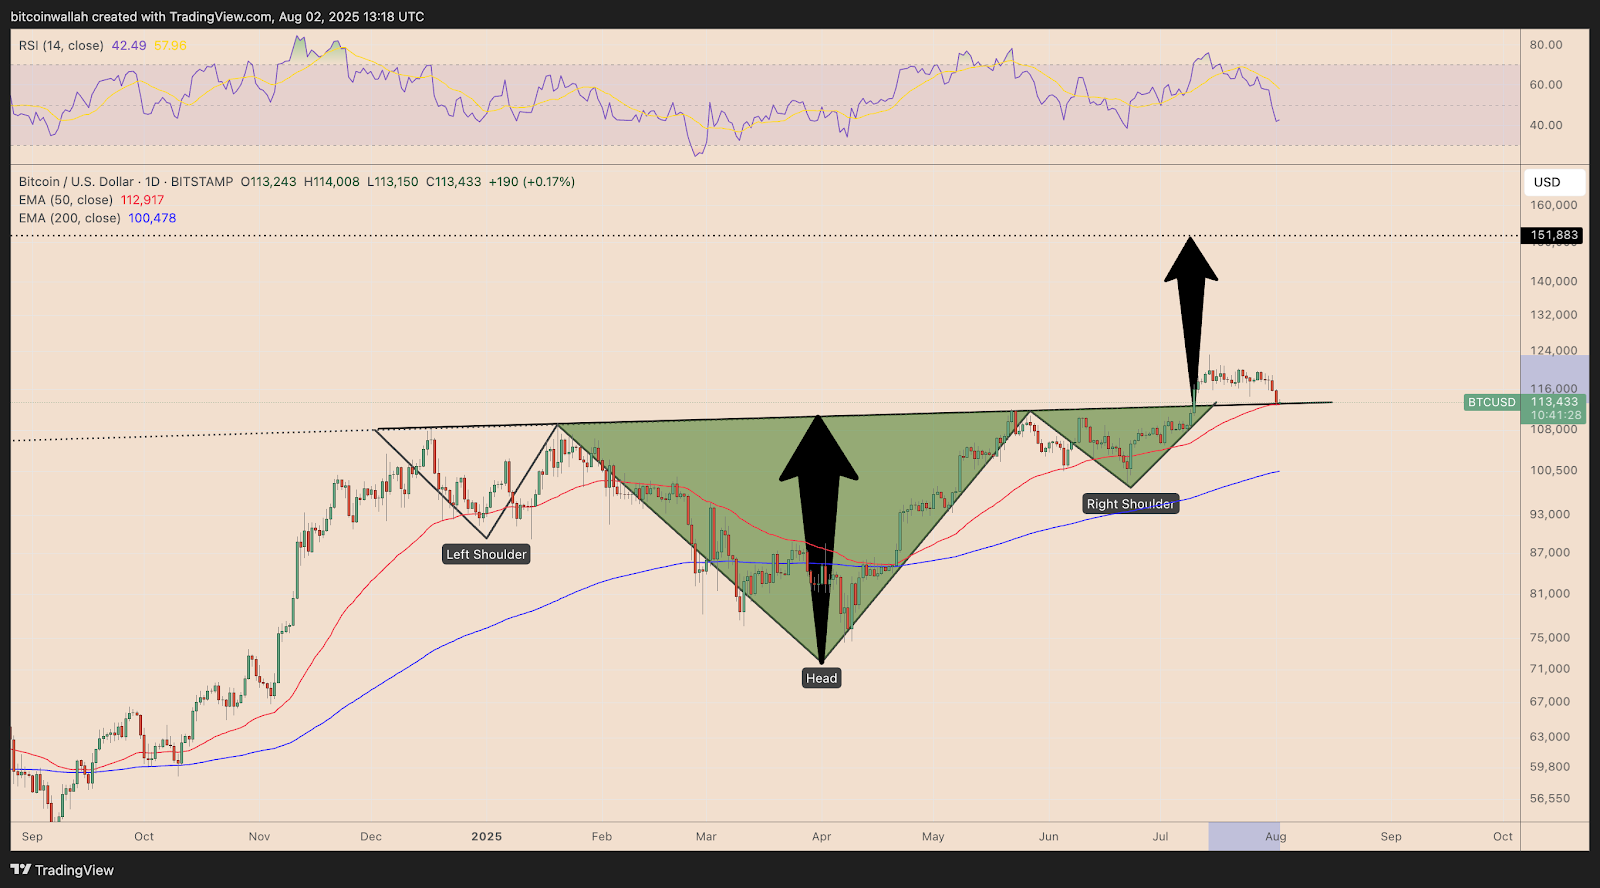
The Bitcoin market is staging a classic battle between bulls and bears. After hitting a historical high of around $123,250, BTC has retraced 7.50% within three weeks, briefly falling below $113below,but analysts see beyond the surface - the strong support of the 50-day Exponential Moving Average (EMA) converging with the neckline of an inverted head and shoulders pattern, forming a "perfect bottom" technical structure. Meanwhile, on-chain data shows that the "old whale's" $9. billion sell-off is not bearish, but rather similar to the profit-taking after the March 2024 ETF approval and Trump's potential election victory at the end2024,, after which the market experienced more intense rallies.
I. Technical Resonance: Double Support Constructing a Bull Market Launchpad
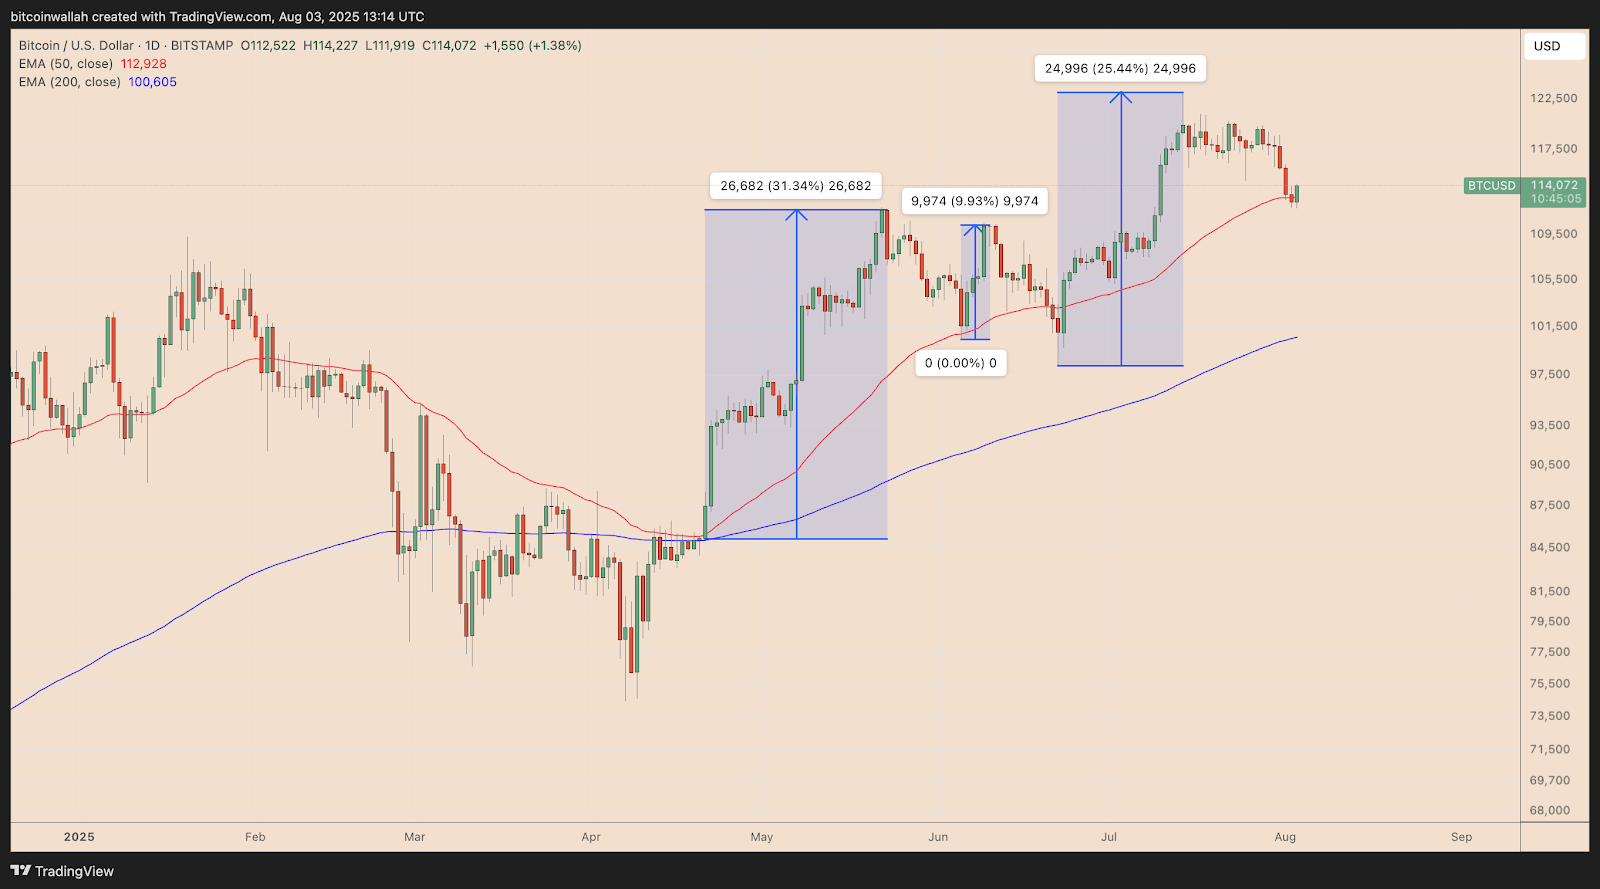
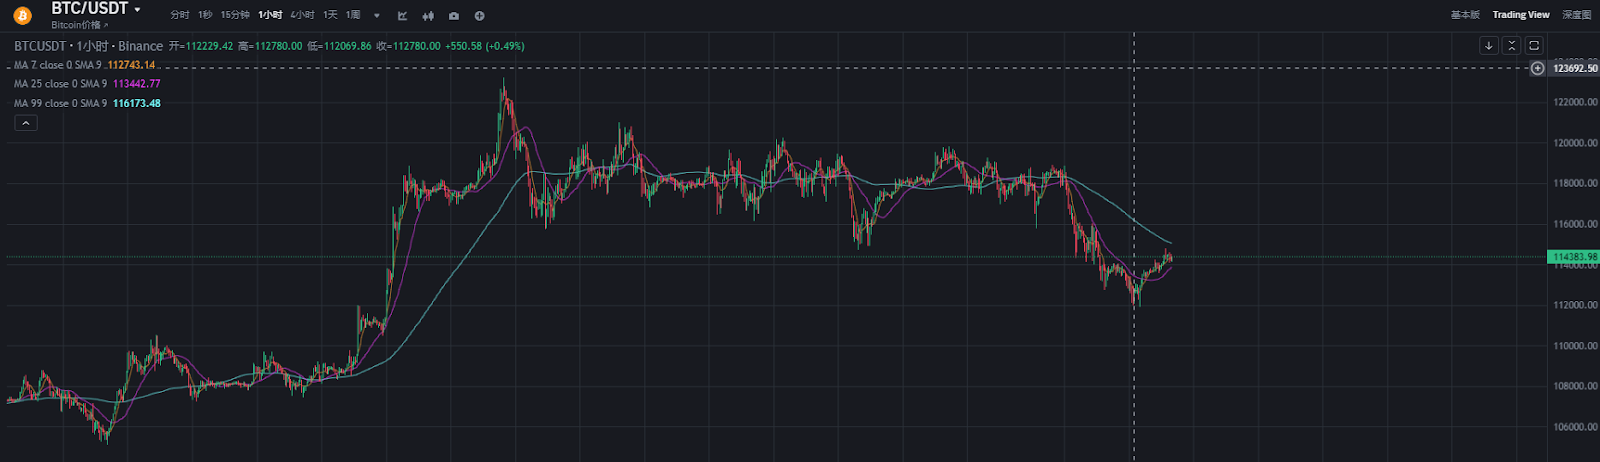
BTC/USD Daily Price Chart. Source: TradingView
 BTC/USD Daily Price Chart. Source: TradingView
The market structure has quietly transformed: CME $115,000 gap filled, high-leverage positions cleared, and financing rates returning to a healthy range, clearing obstacles for a "net bullish rise".
II. Whale Game: The Cooling Mechanism Behind $9.6 Billion Sell-off
Both Both Bitcoin "old whales" and "new whales" have profited. Source: CryptoQuant
On-chain data reveals the strategic deployment of institutional-level funds. CryptoQuant monitoring shows three concentrated whale profit-taking waves in this bull market:
- < After the US spot Bitcoin ETF approval, $8.5 billion 5 instimulated the first round of sell-off
- November 2024: Trump's election victory pushing BTC above $100,000 the second round of reduction
- July 2025: After historically breaking $120,000, "old whales" transferred 80,000 BTC (about $9.6 billion) in a single instance
These "whale descending" events are accompanied by 2-4 months of consolidation, serving as a natural market cooling valve.

However, current data indicates show thatales to Addresses holding -10,000 BBincreased,105 the with exchange balances dropping to 2.24 millionTC (six-year low), indicating strong long-term holder reluctance to sell><>
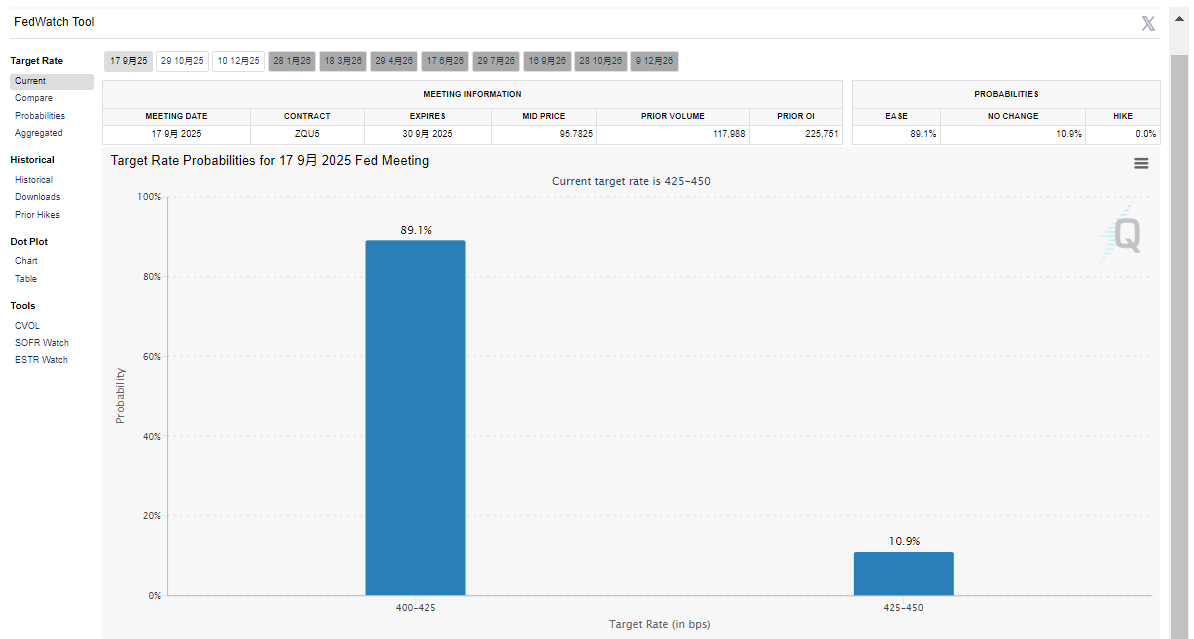
CME Rate Forecast
Bitcoin's rise logic is deeply tied to global monetary policy. The US July non-farm data "a unexpectedly" only 73,000 jobs added unemployment rate rising to to4%), completely reversingeinging expectations, with the Federal Reserve's September rate cut soaring%. This confirms the previous Snowball column's prediction: Under the overlay of $31 trillion issuance and rate cut cycle, Bitcoin will benefit from the fiscal-led"m span p>Transformation of capital capital inflow:
Multiple technical models point to the 140,000-150,000 target range:
- Rounded bottom pattern theory: After breaking the neckline at $106,,660 on the daily chart, the measured target is $140,000 37% higherabthan li VIX correlation model When: volatility index is below 18 in a "risk appetite" environment, network economist Timothy Peterson predicts a 100-day target target of $135,000 (% accuracy)ving rule: After fourth the fourth halin May 2024historical data12-18 months show bull market peak, October October 2025 becomes a key time window window
While mainstream media remains cold and retail investors panic due to non-farm data, smart money is strategically positioning. From CME gap filling to whale handover, from rising rate expectations to corporate hoarding trend, technical and fundamental aspects have formed an upwardlywardly resonance. If historical patterns repeat, the current volatility might be the final wash before before Bitcoin charges towards $150,000.