Ethereum's network just flashed its strongest on-chain signal in 24 months—daily active addresses surging past previous resistance levels. Forget 'quiet accumulation'—this is a full-blown revival party.
The Metric That Moves Markets
When users swarm the blockchain, liquidity follows. Traders are now dissecting whether this spike reflects DeFi's comeback, NFT mania 3.0, or just old-fashioned speculation wearing a Web3 mask.
Price Implications: Bullish or Bull Trap?
History says ETH tends to rally when activity peaks—but Wall Street quants (busy chasing AI stocks) might need three fiscal quarters to notice. Meanwhile, crypto OGs are already front-running the institutional FOMO.
One thing's certain: the 'ultrasound money' narrative just got a defibrillator jolt. Whether that translates to price action—or another 'buy the rumor, sell the news' circus—depends on whether Ethereum's fundamentals can keep pace with its hype cycle. As always in crypto, trust the code—not the VC pitch decks.
USDT Trends Show Broader Market Caution
Glassnode reports that the 30-day moving average transfer volume of USDT has risen to $52.9 billion, recovering from 2022’s market downturn. But Ethereum’s share of USDT transaction volume has decreased.
https://twitter.com/CryptosR_Us/status/1951283799016317415Currently:
- Tron leads with $23 billion in USDT volume
- BNB follows at $14.9 billion
- Ethereum trails both
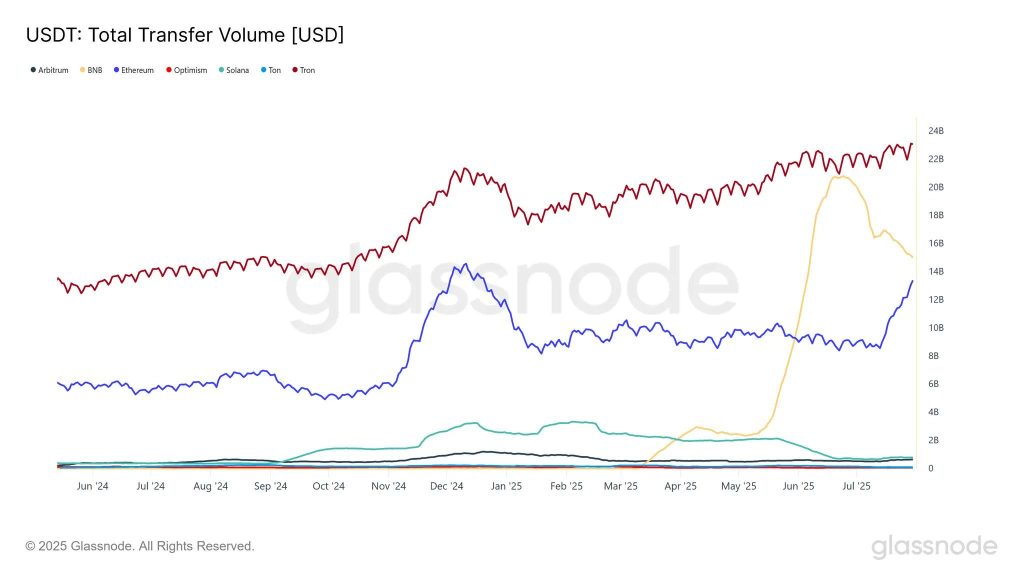
This drop in stablecoin settlement dominance could mean while ethereum network activity is up, transactional preference is shifting to lower-fee chains for stablecoin usage—especially with volatile ETH gas prices.
ETH/USD Technical Outlook: Short Bias Persists
From a price action standpoint, Ethereum price prediction is looking weaker. ETH has broken below $3,548 and failed to hold above the rising trendline that had been in place since mid-July. A bearish engulfing pattern, followed by three large-bodied red candles (like the Three Black Crows), confirms distribution.

Key signals:
- RSI at 28.97: Oversold but no bullish divergence
- 50-period SMA at $3,745 is resistance
- Lower highs and lower lows is a descending triangle
to watch:
- $3,428 (next critical zone)
- $3,331 and $3,235 (targets on breakdown)
Trade Setup:
If ETH retests $3,548 and gets rejected (e.g. shooting star), short at $3,548 with stop above $3,600 and targets at $3,428 or lower. More aggressive WOULD be to short at $3,428 with targets at $3,331 and $3,235. Need to get back above $3,651 and the trendline to flip the bias bullish.
Bitcoin Hyper Presale Over $6.2M as Price Rise Nears
Bitcoin Hyper ($HYPER), the first BTC-native Layer 2 powered by the Solana VIRTUAL Machine (SVM), has raised over $6.2 million in its public presale, with $6,278,761 out of a $21,644,097 target. The token is priced at $0.0115, with the next price tier expected to be announced soon.
Designed to merge Bitcoin’s security with Solana’s speed, Bitcoin Hyper enables fast, low-cost smart contracts, dApps, and meme coin creation, all with seamless BTC bridging. The project is audited by Consult and engineered for scalability, trust, and simplicity.
The golden cross of meme appeal and real utility has made bitcoin Hyper a Layer 2 contender to watch in 2025. With staking, a streamlined presale, and a full rollout expected by Q1, $HYPER is gaining serious traction.