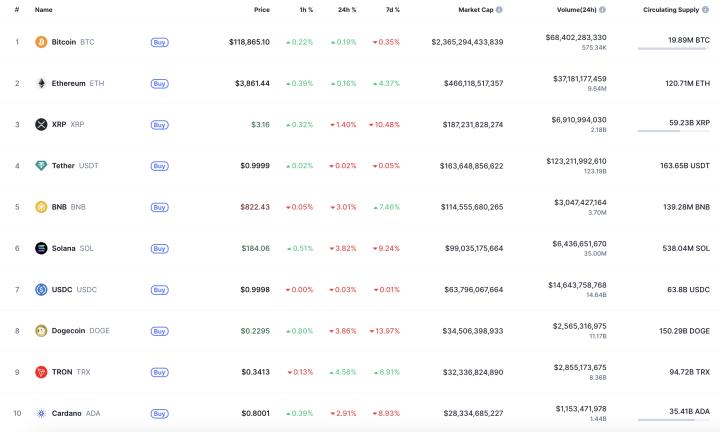
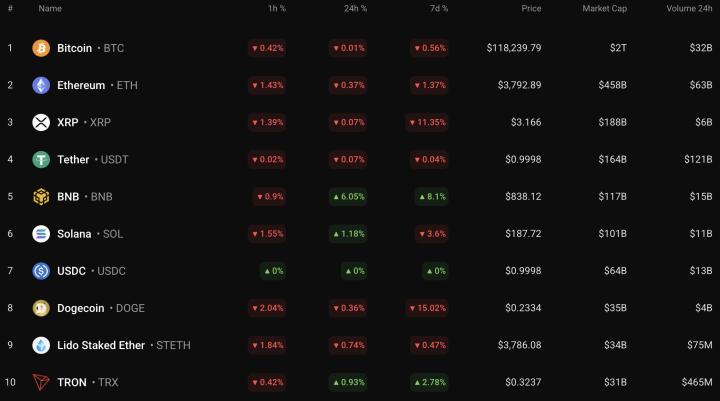
Most coins from the top 10 list are going down today, according to CoinStats.
SHIB/USD
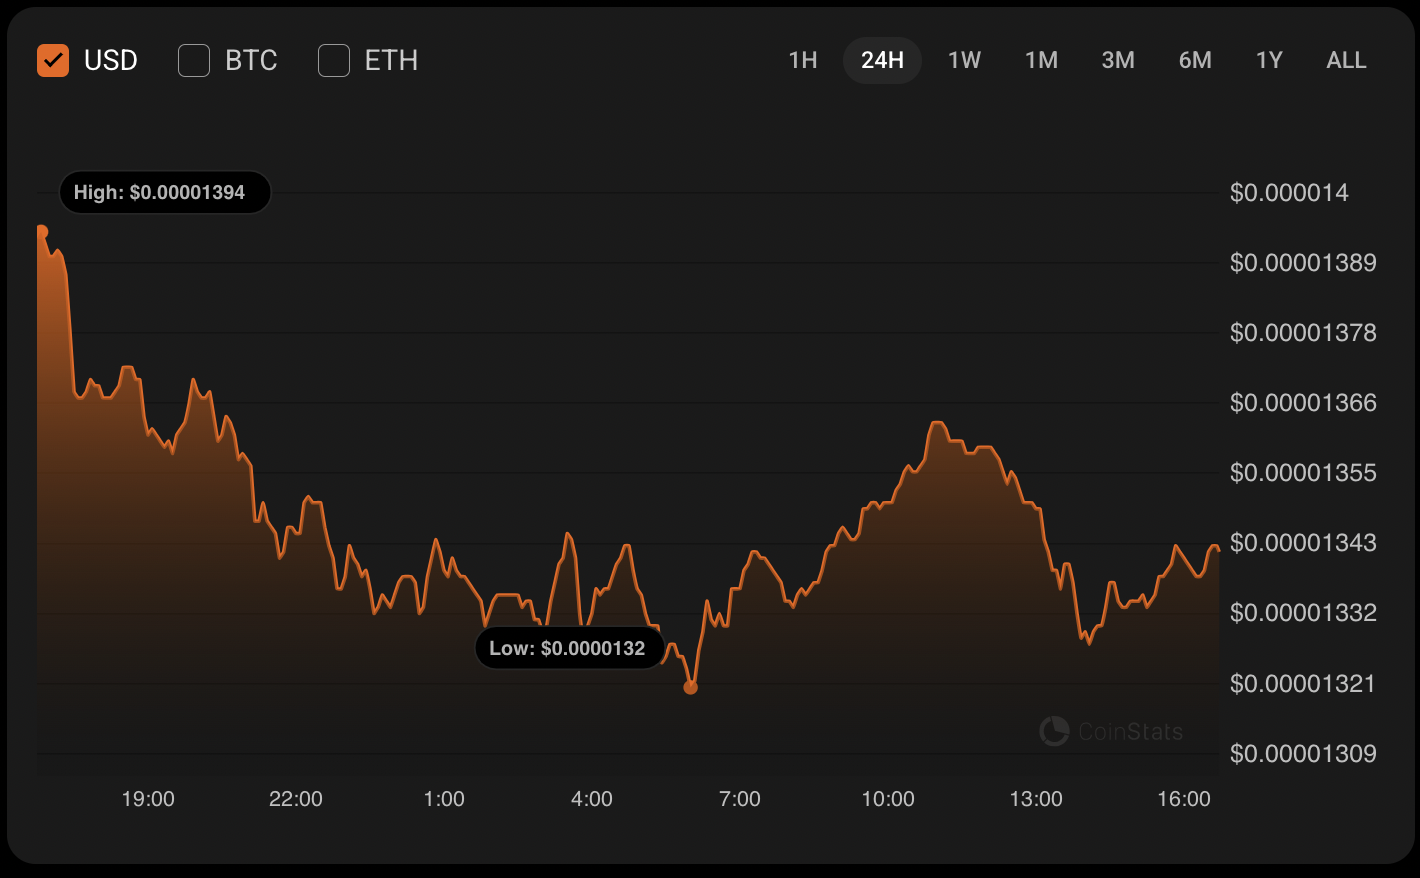
The price of SHIB has declined by 3.79% over the last 24 hours.
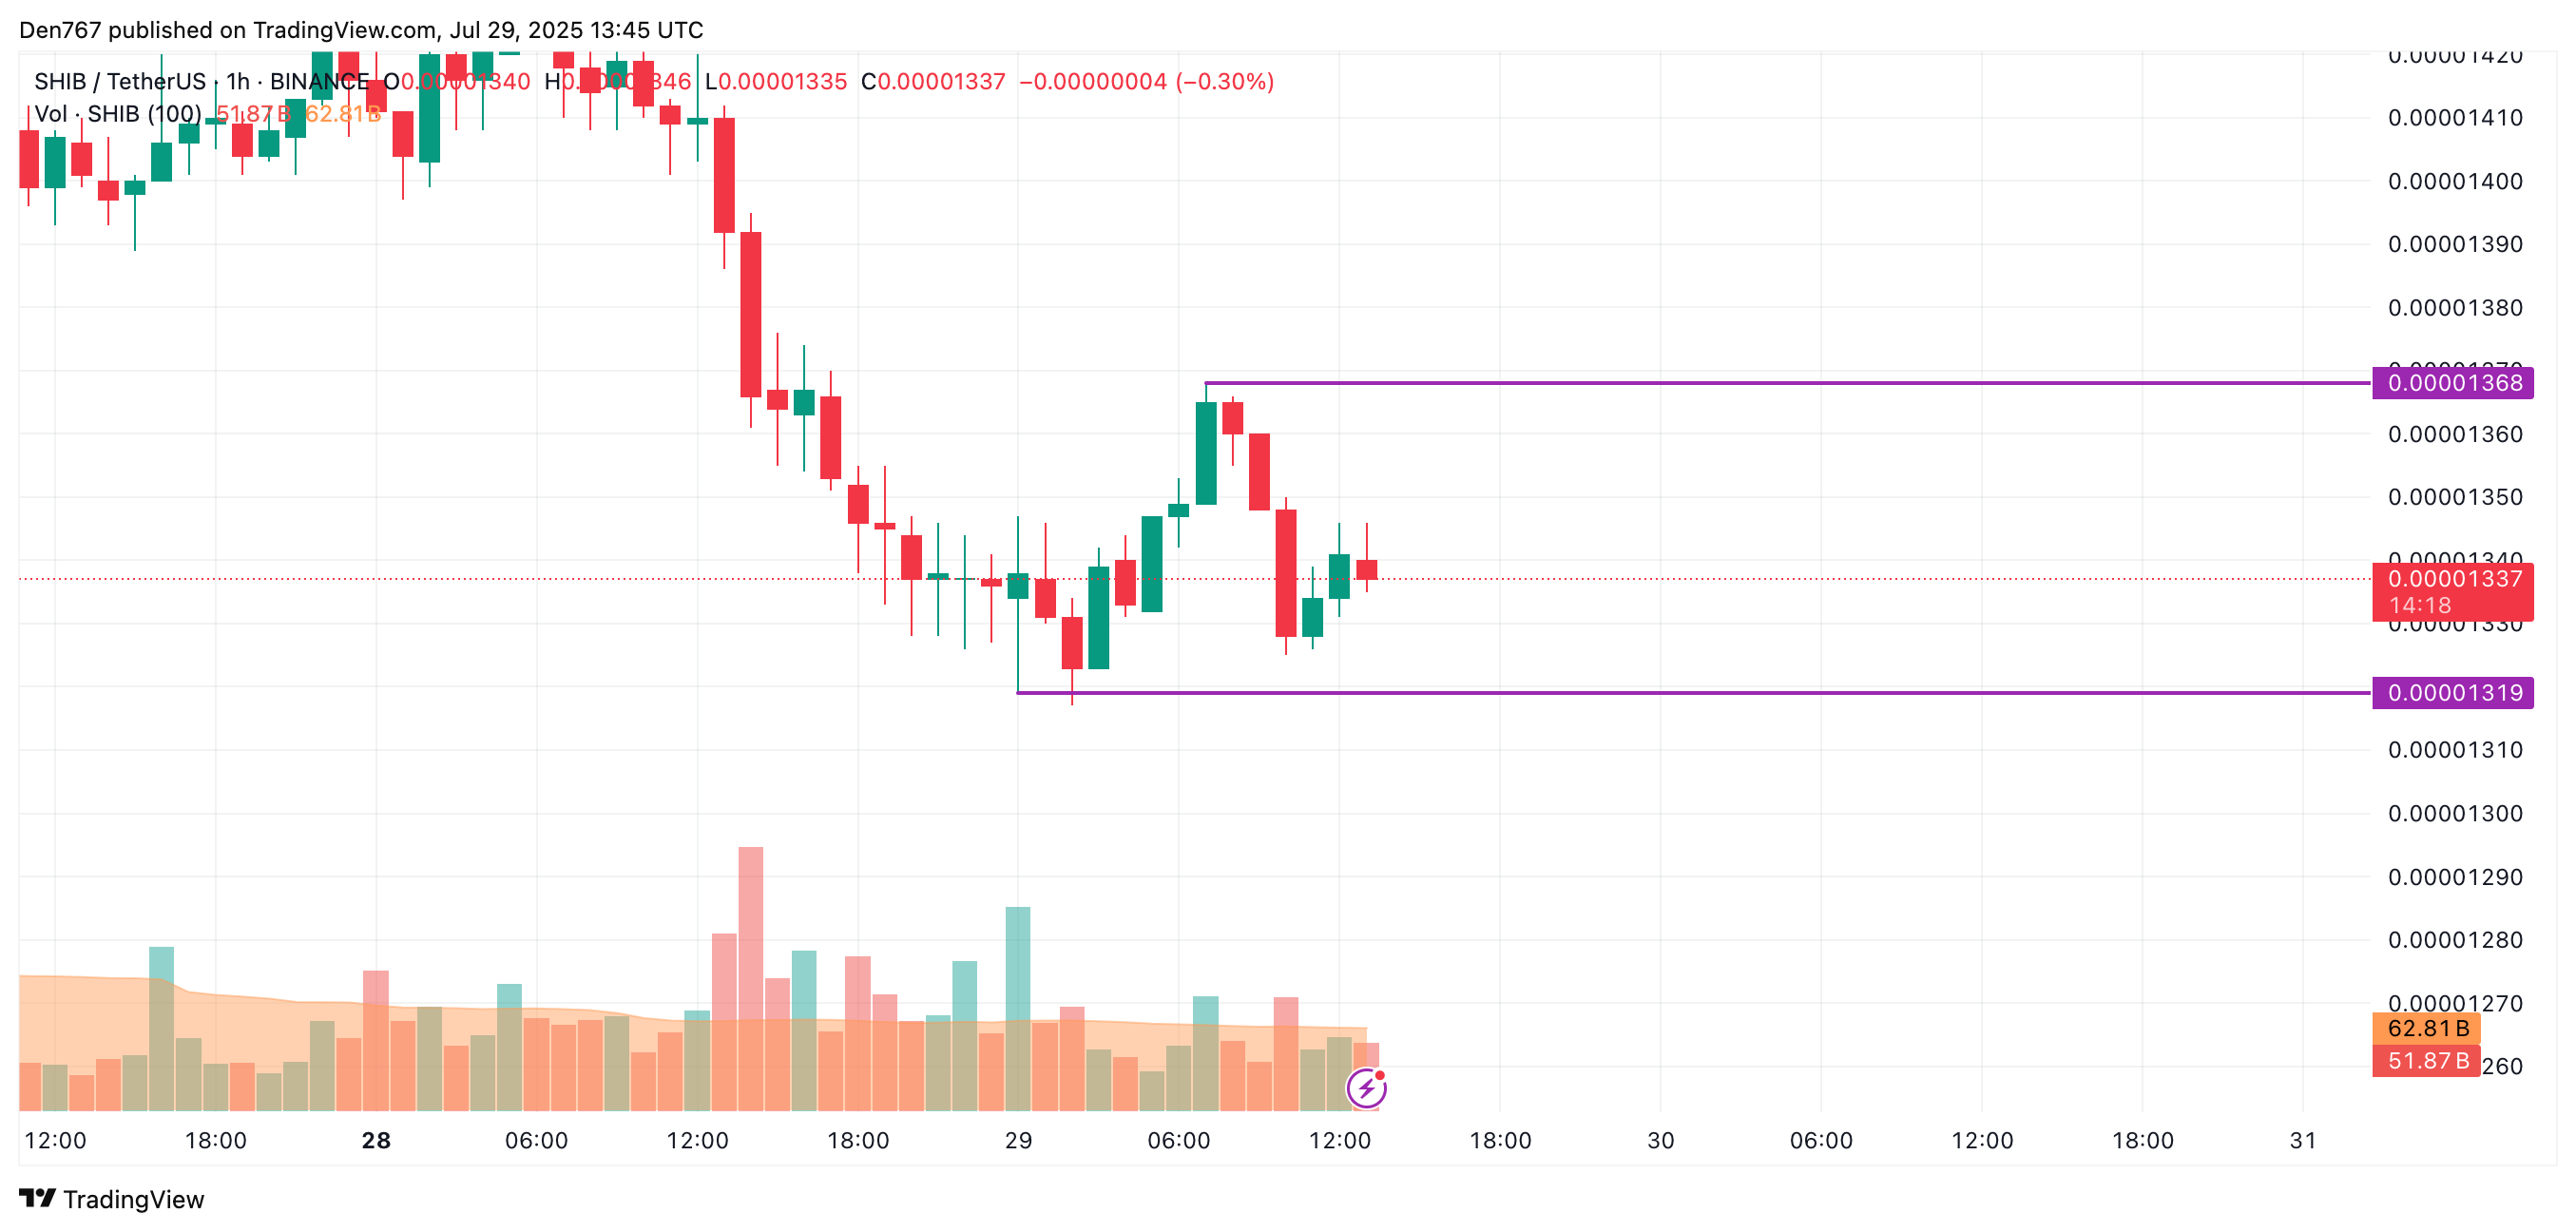
On the hourly chart, the rate of SHIB is closer to the support than to the resistance level. If the daily bar closes around the current prices or below, one can expect a test of the $0.000013 zone shortly.
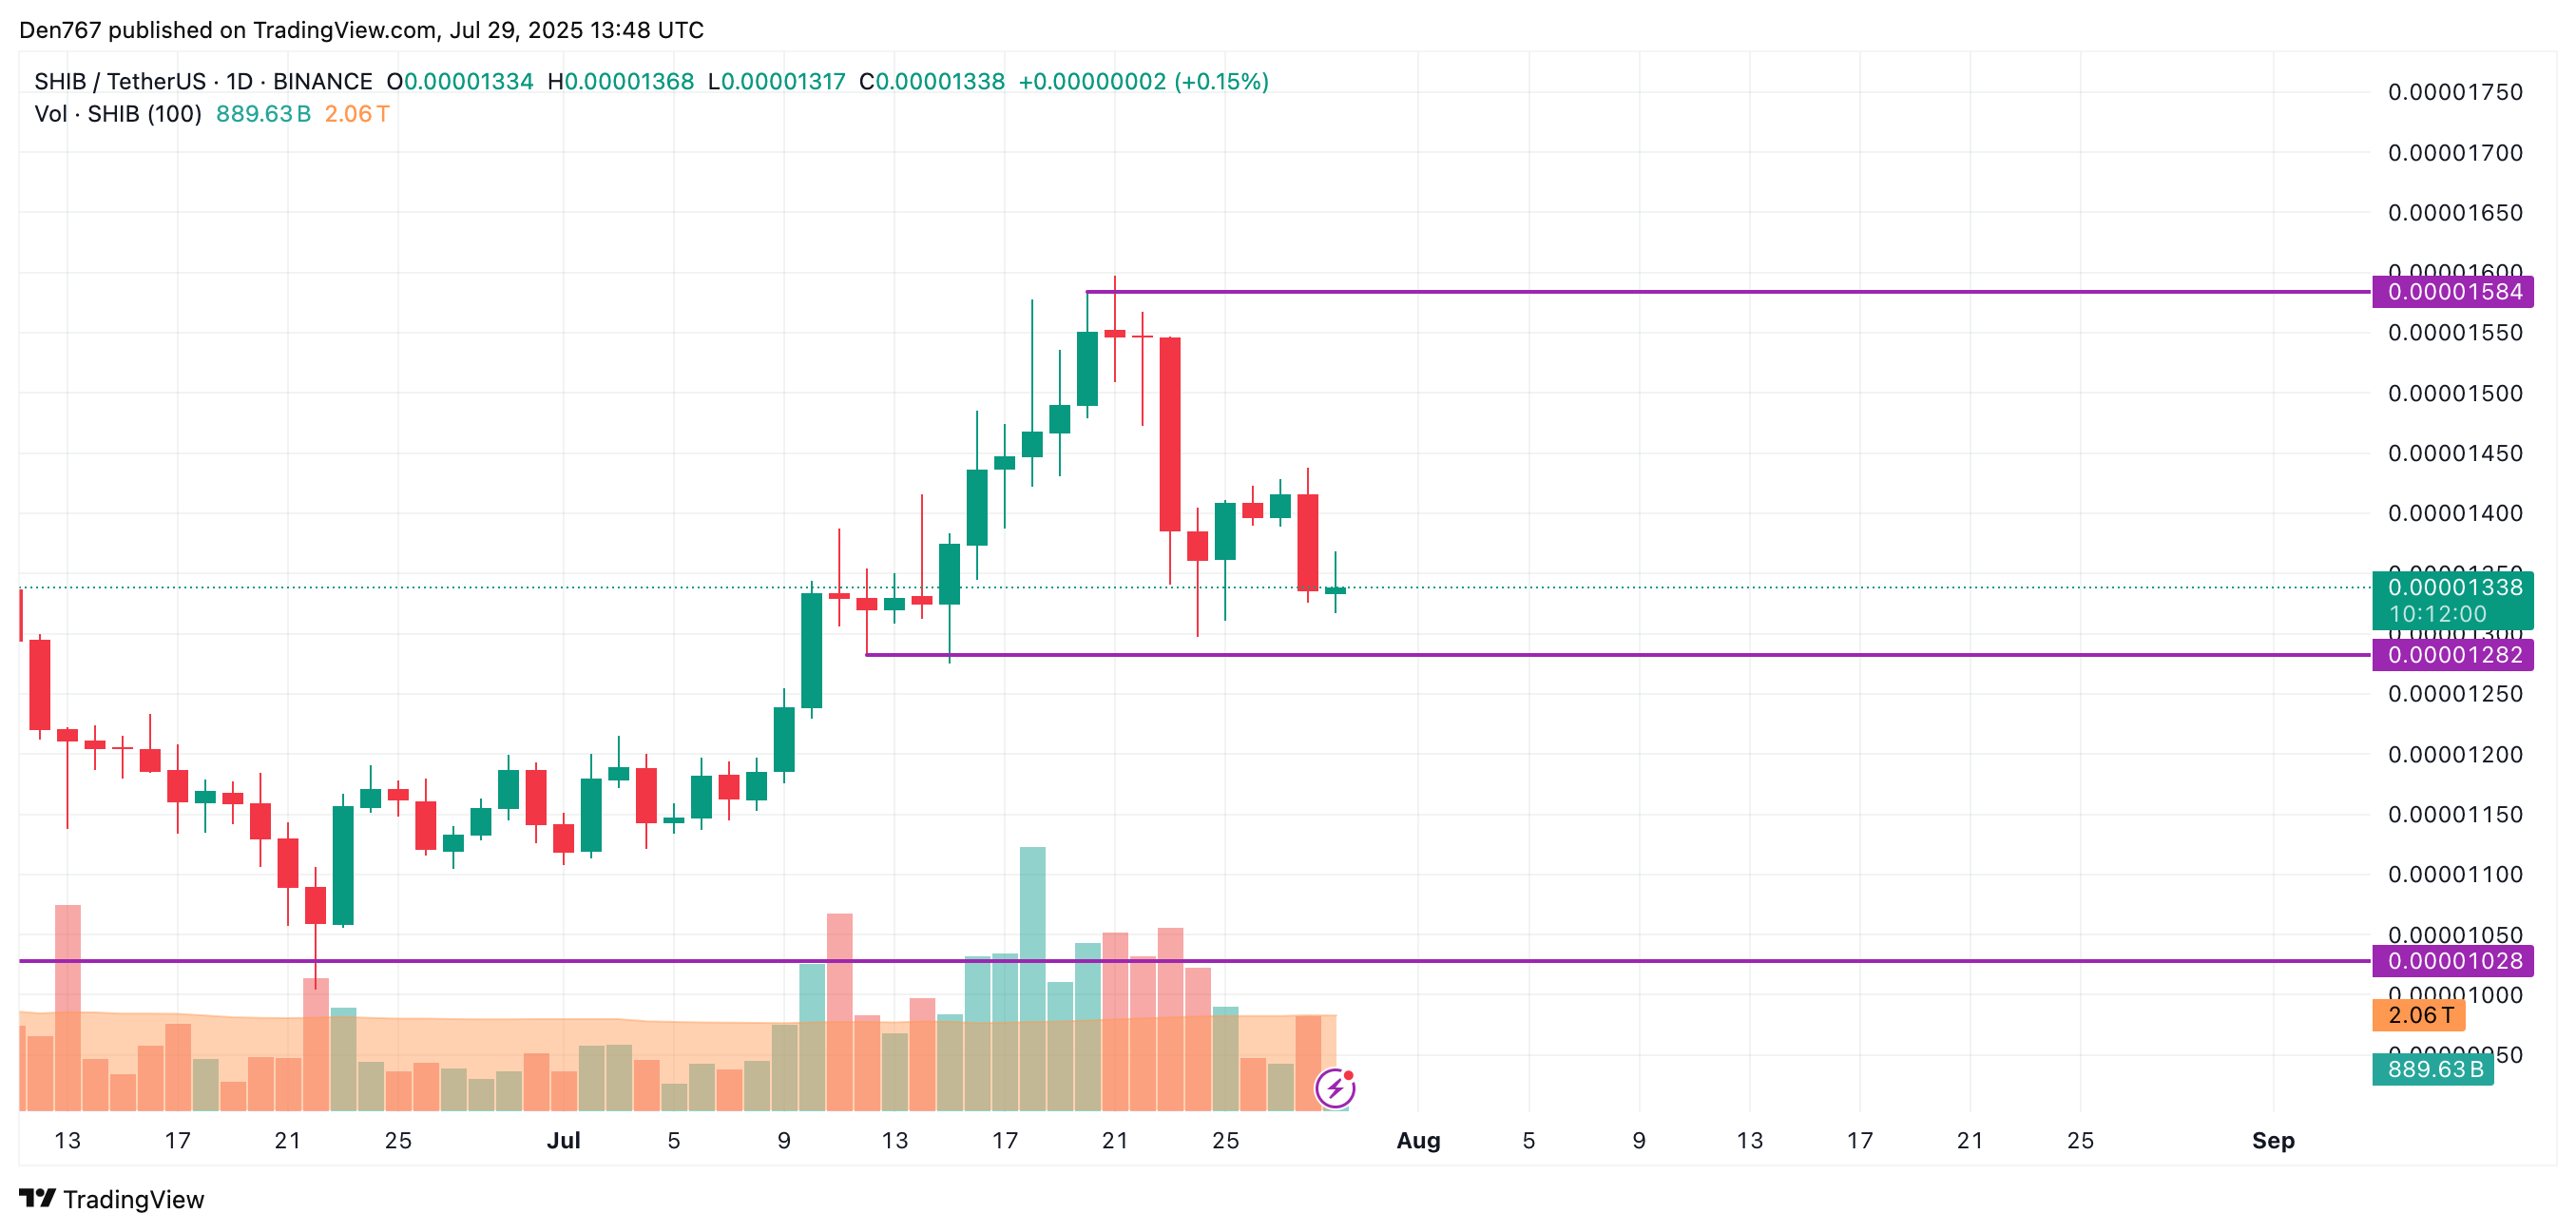
On the longer time frame, the picture is also more bearish than bullish. If the breakout of the $0.00001282 support happens, the accumulated energy might be enough for a move to the $0.000012-$0.00001250 range.
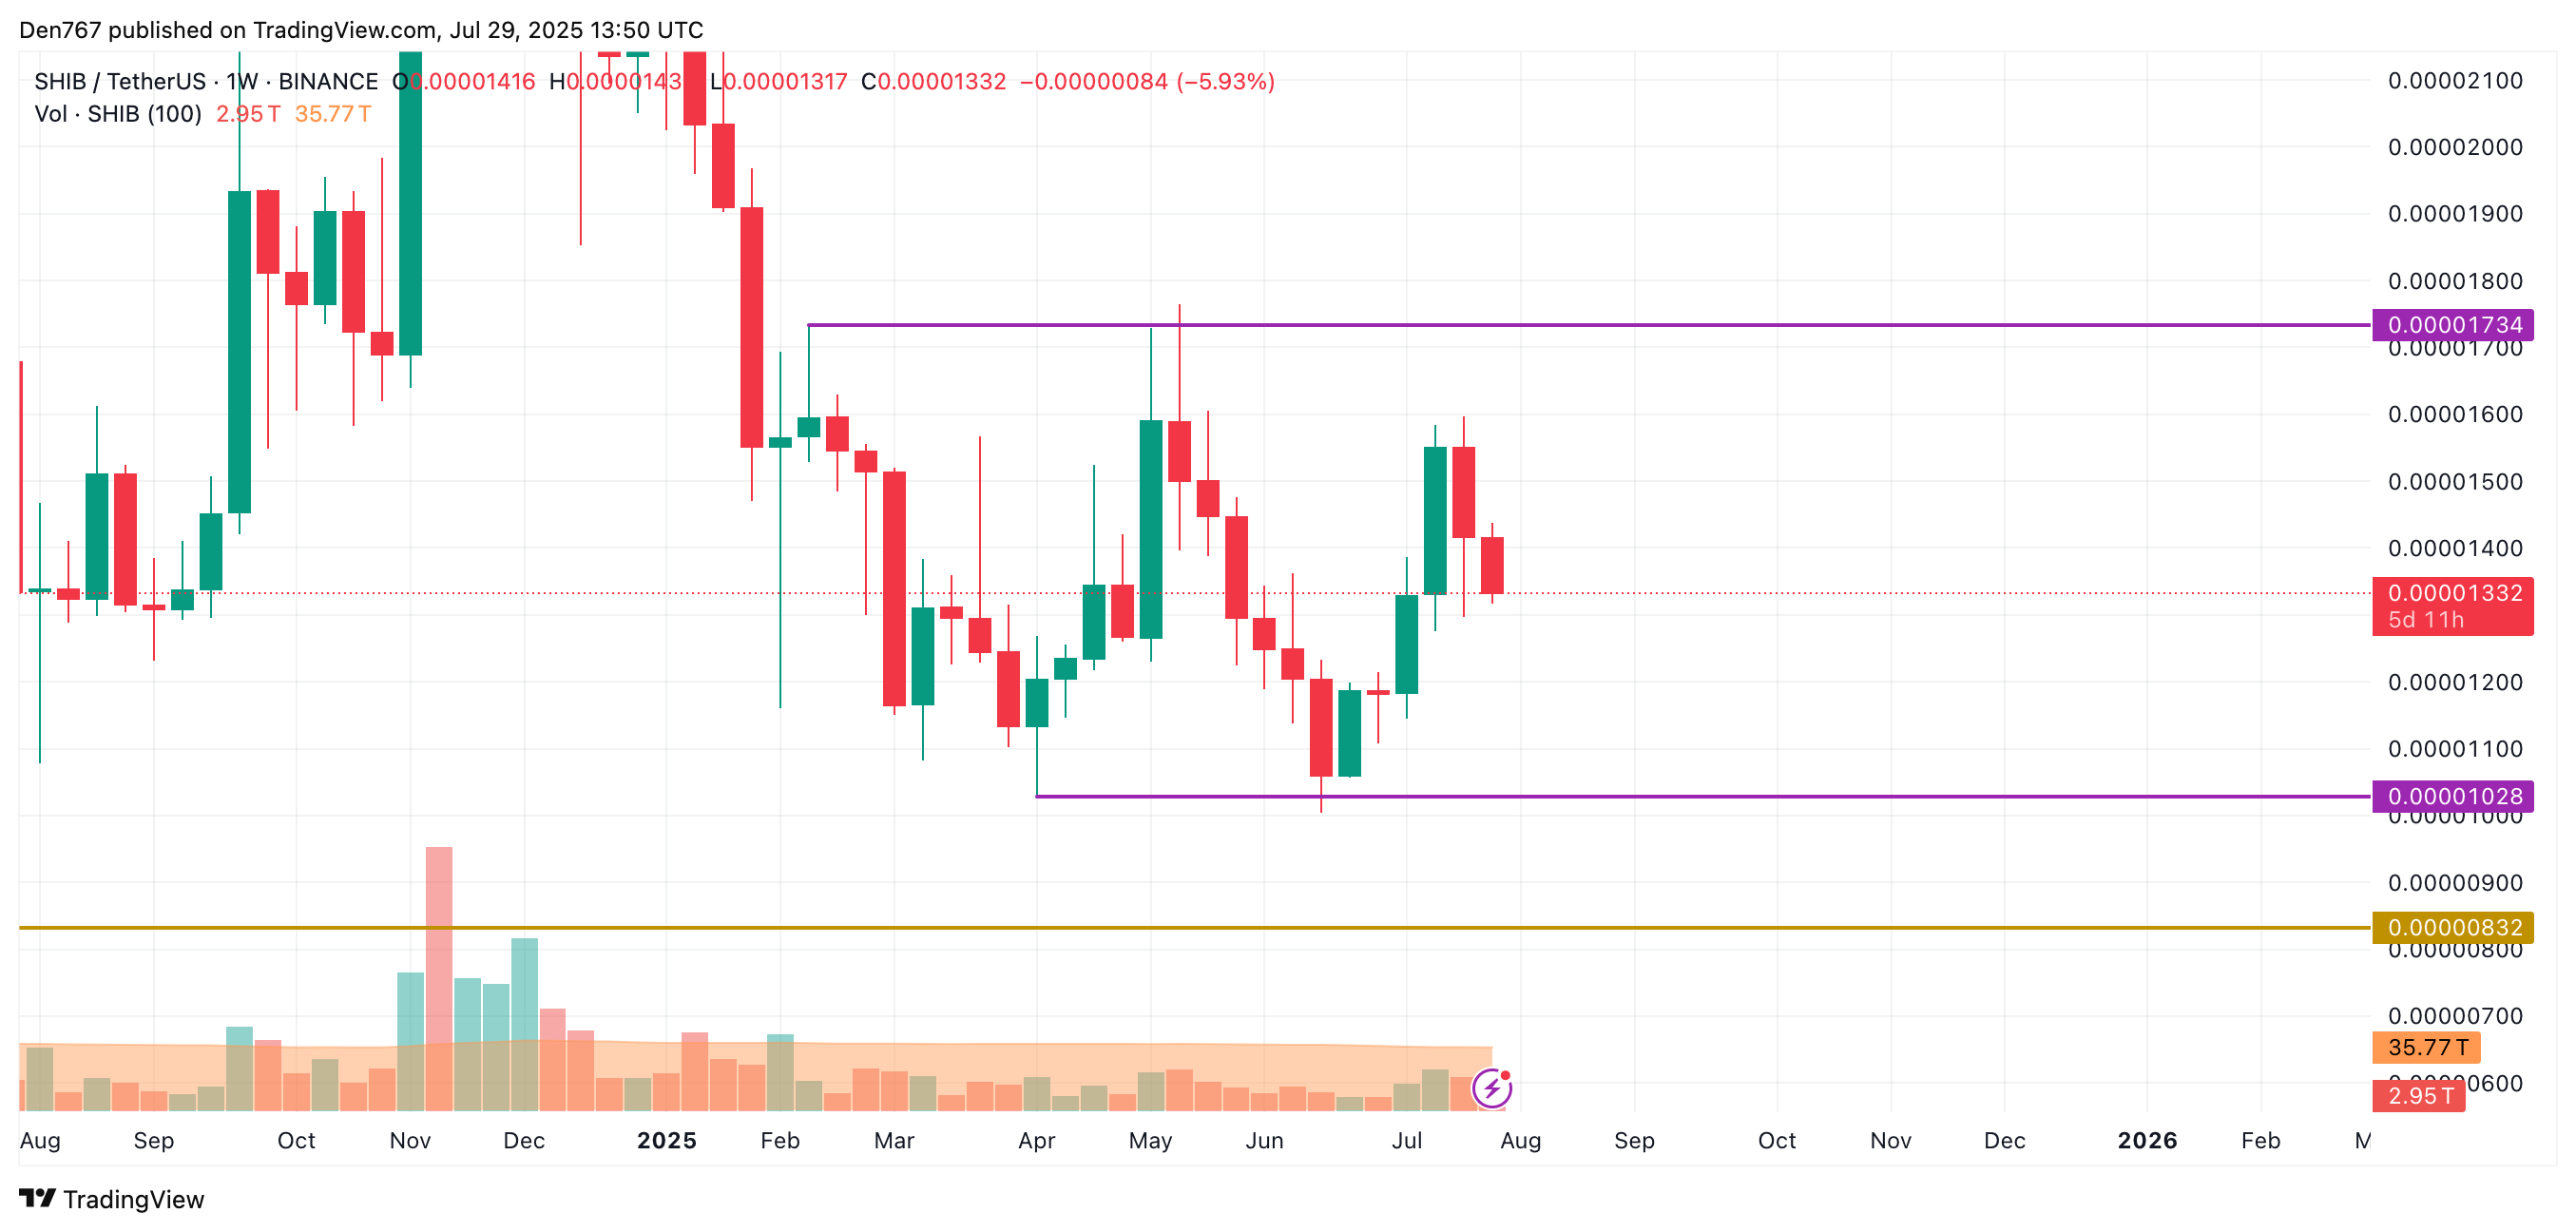
From the midterm point of view, the rate of SHIB is in the middle of a wide channel, between the support of $0.00001028 and the resistance of $0.00001234.
However, if the breakout of the interim level of $0.000013 happens, there is a high chance of seeing a test of the $0.0000110-$0.000012 range.
SHIB is trading at $0.00001332 at press time.