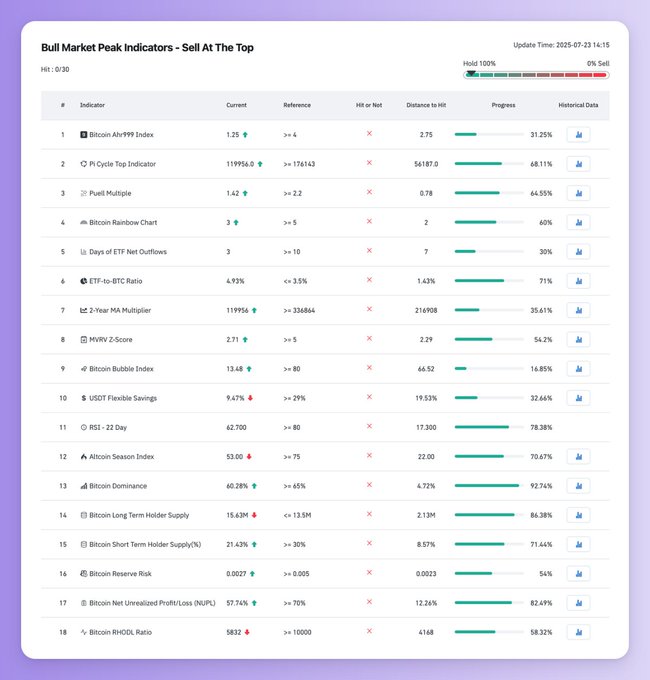
This dashboard by @coinglass tracks 30 metrics to spot bull market peaks.
Here are 10 that will help you sell on top.
[ Research series ]↓
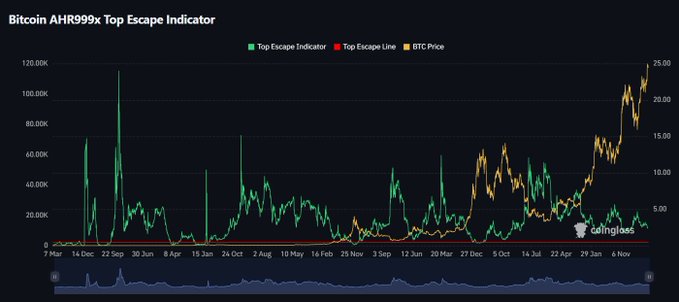
10. AHR999x Top Escape Indicator:
This chart shows when BTC is moving too far above its normal range.
If the green line jumps over the red line, it’s a sign the market might be getting too hot and a top could be close.
• Above red = danger zone
• Now = still safe
Track here: coinglass.com/pro/i/ahr999-esc...…
None of these charts will call the top perfectly but together, they help you see when the crowd stops thinking.
That’s why charts like these matter, not to predict, but to prepare.
Because selling isn’t about timing it right, it’s about spotting the moment when everyone thinks nothing can go wrong.
From Twitter
Disclaimer: The content above is only the author's opinion which does not represent any position of Followin, and is not intended as, and shall not be understood or construed as, investment advice from Followin.
Like
Add to Favorites
Comments
Share