

Written by: White55, Mars Finance
Prelude: Price Breakthrough and Whale Maneuvering
On June 10, 2025, Ethereum's price broke through $2,827 with a sharp offensive, creating a 15-week high. Behind this figure, a liquidation storm involving $1.8 billion in short positions is brewing. In this seemingly coincidental market movement, the trading trajectory of a mysterious whale has become a key footnote in interpreting market sentiment.
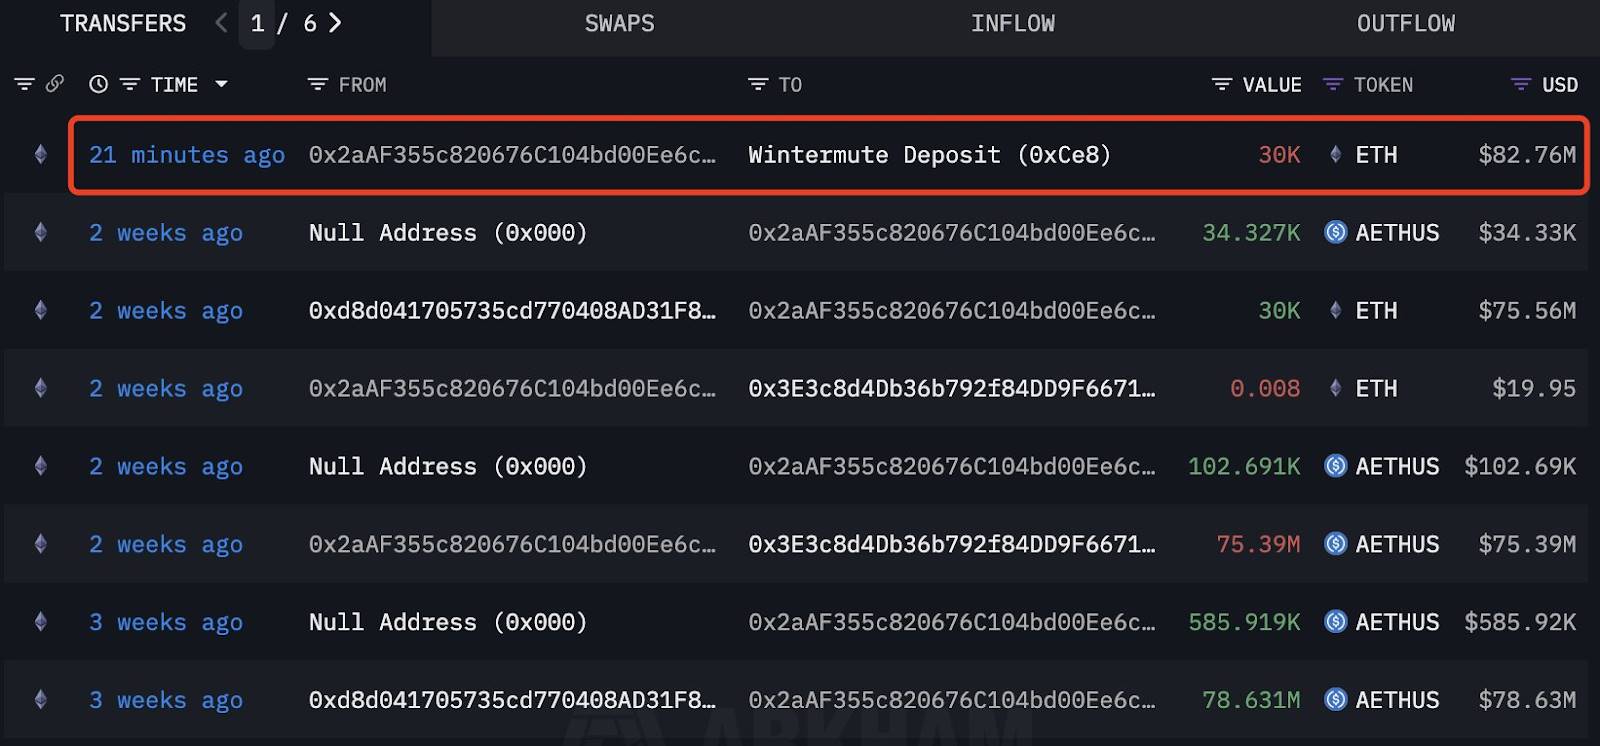
ETH whale trading activity. Source: Lookonchain/X
According to on-chain tracking platform Lookonchain, an anonymous address completed two precise strikes within 44 days:
First round (April 27): Accumulated 30,000 ETH through Wintermute OTC at an average price of $1,830, spending $54.9 million;
Second round (May 27): Sold the same amount of tokens at $2,621, gaining $23.73 million, with a return rate of 43%;
Final harvest (June 10): Again sold 30,000 ETH through over-the-counter trading for $82.76 million, locking in $7.3 million in profit, with a cumulative gain of $31 million.
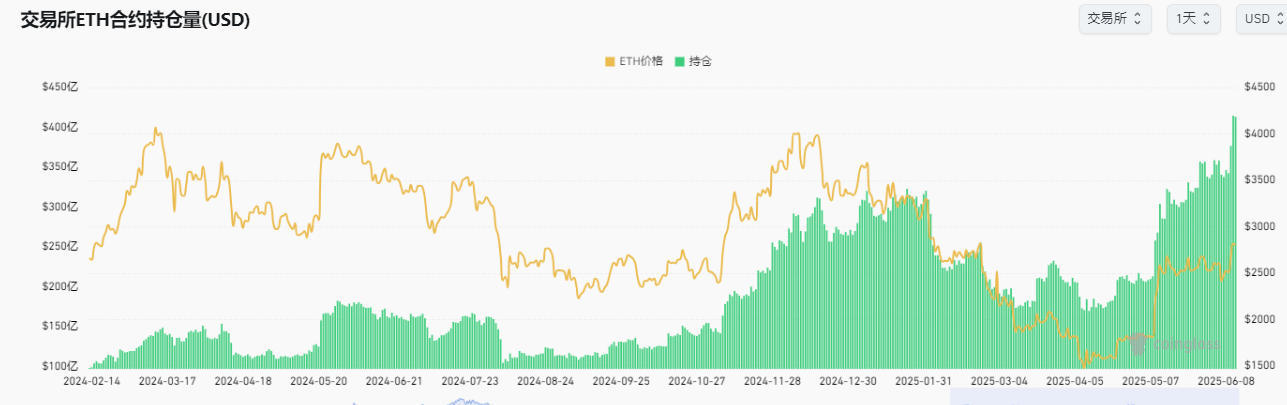
Such operations are far from unique. CoinGlass data shows that Ethereum futures open interest (OI) has broken the $40 billion mark for the first time, with market leverage approaching a critical point. The current liquidity map presents a delicate balance: around $2,600, there is a $2 billion long liquidation risk, while above $2,900, there is $1.8 billion in short liquidation ammunition. This long-short confrontation is reminiscent of the CDO market in "The Big Short" - a breakthrough in any direction will trigger a chain reaction.
Chapter Two: Ecological Expansion and Value Cracks
Behind the price carnival, Ethereum's ecosystem is experiencing a structural transformation.
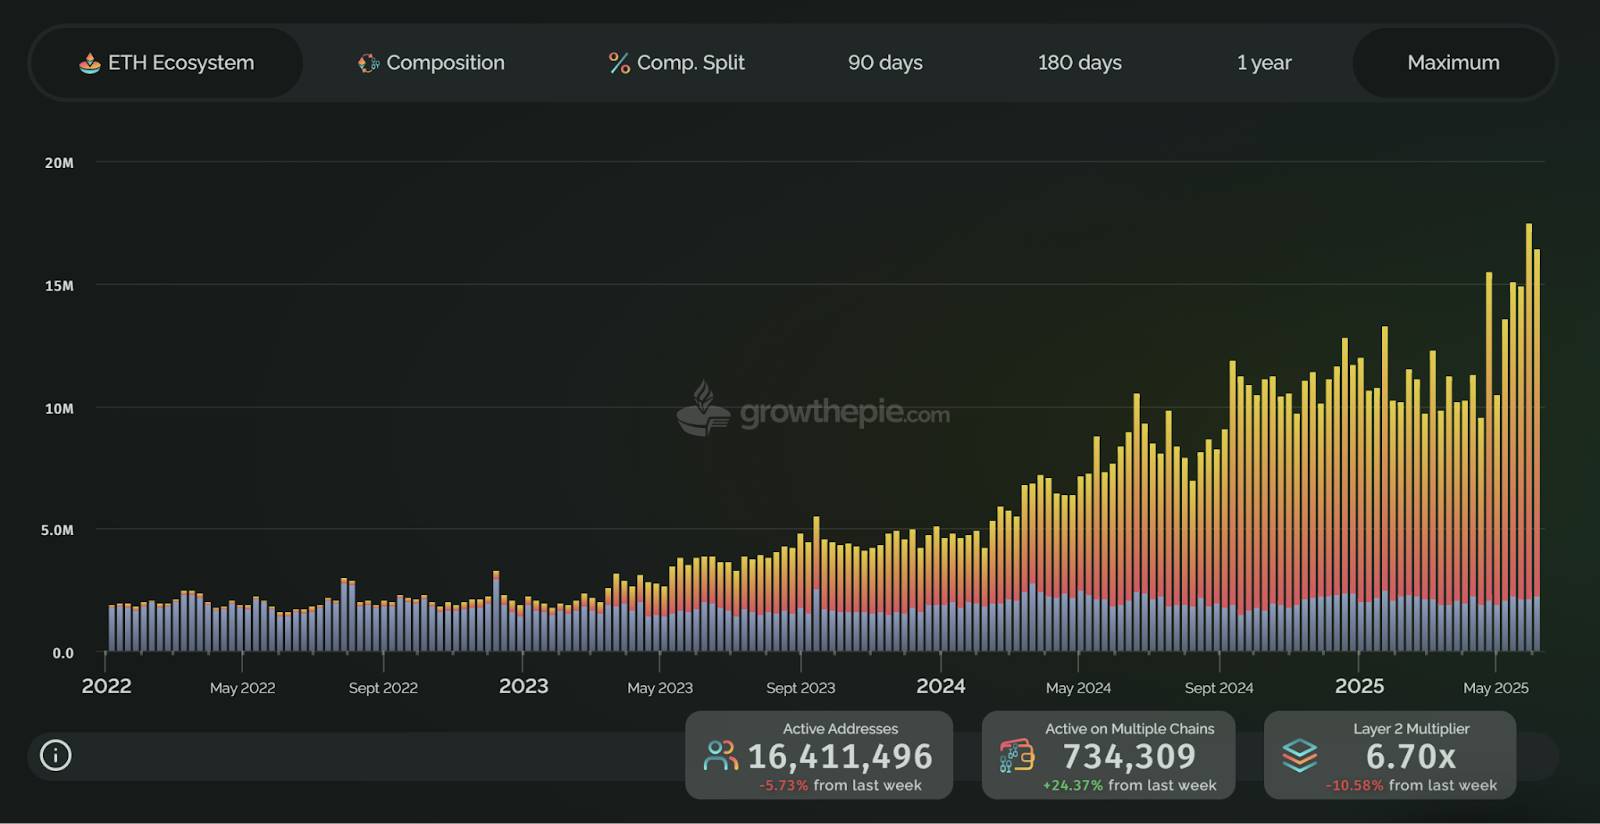
Ethereum weekly address participation chart. Source: growthepie
Growthepie data shows that independent active addresses surged by 70% in the second quarter, reaching a peak of 16.4 million on June 10. Among these, Base network accounted for 72.81% (11.29 million addresses), becoming the growth engine, far exceeding Ethereum mainnet's 14.8% (2.23 million addresses). This "satellite chain nourishing the mainnet" model is entirely different from the DeFi Summer narrative of the 2020s.
Although Ethereum still occupies 61% of the DeFi market with a $66 billion TVL, its core revenue model shows hidden concerns:
Fee collapse: Network fees in the past 30 days were only $43.3 million, a 90% drop from before the Cancun upgrade;
Staking yield dilemma: While Blob technology reduces Layer2 costs, stakers' annual yield continues to wither at 3.12%, far inferior to competitors like Solana;
Regulatory shackles: SEC's review of ETH staking has led to 8 consecutive days of $369 million net outflows from spot ETFs, causing cracks in institutional faith.
This contradiction is embodied in Glassnode's on-chain data: the proportion of "diamond hand" addresses holding ETH for over a year has plummeted from 63% to 55%, while short-term holder selling has surged by 47%. When technical upgrades fail to convert into holder returns, ecosystem prosperity becomes a dilution of value.
Chapter Three: The Bloody Compass of the Derivatives Market
The futures market is turbulent, with ETH futures open interest (OI) breaking $40 billion for the first time, indicating high market leverage. The significant increase in open interest suggests potential volatility.
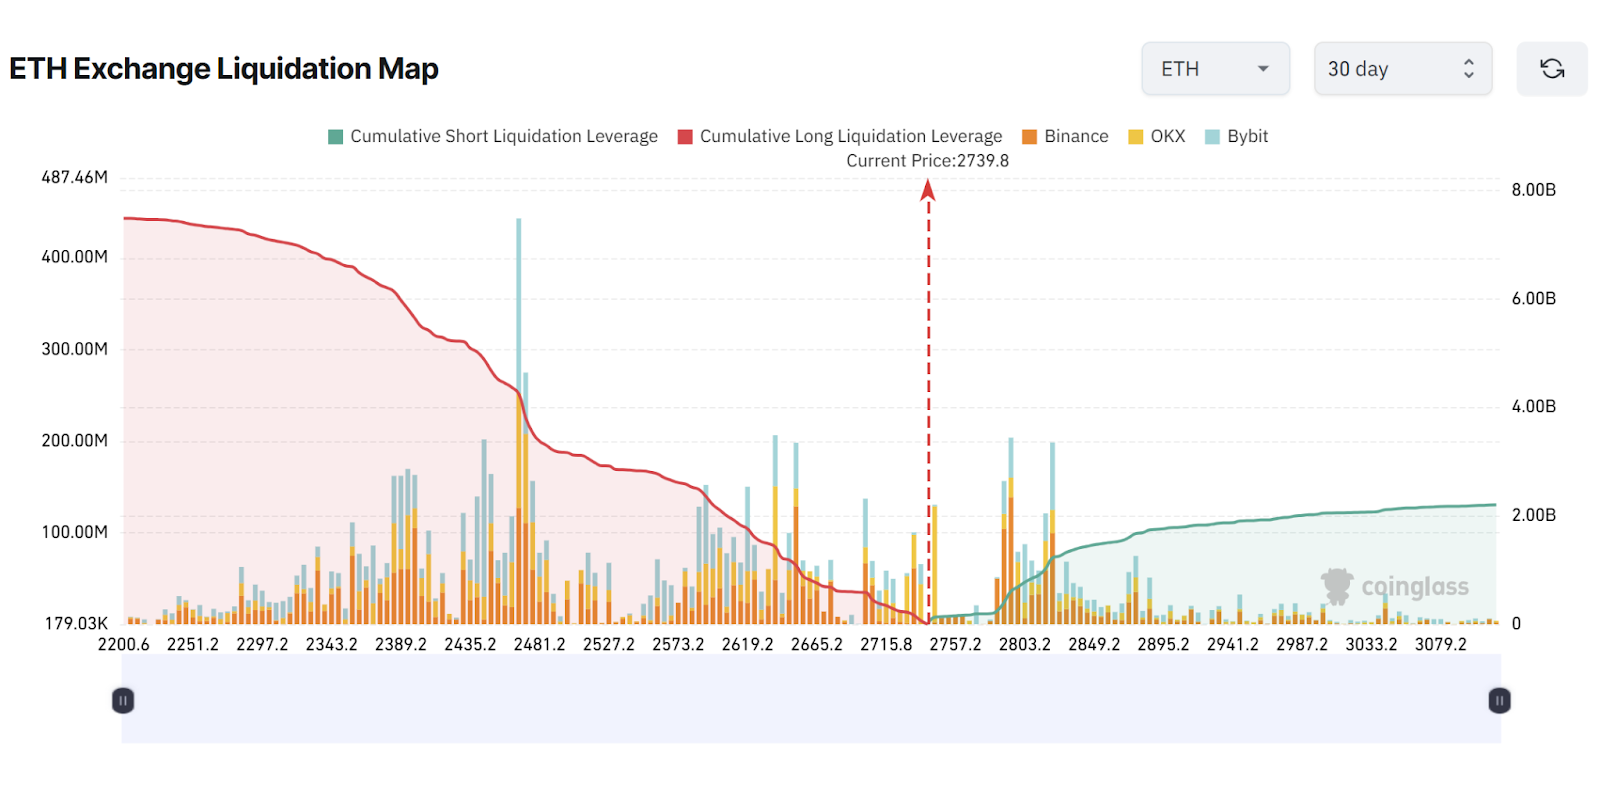
Ethereum liquidation chart. Source: CoinGlass
CoinGlass liquidation heat map reveals the brutal logic of capital speculation:
Long minefield: $2 billion liquidation risk accumulated in the $2,600-2,665 range, which is precisely the 50% Fibonacci retracement point of the 2024 bull market;
Short graveyard: $1.8 billion short positions hanging by a thread above $2,900, corresponding to the historical low of 0.019 in the ETH/BTC exchange rate;
Institutional duality: CME Ethereum futures open interest accounts for 9%, in contrast to Bitcoin futures' 24% institutional dominance, suggesting traditional capital remains cautious.
The abnormal prosperity of the derivatives market is a manifestation of the liquidity trap. When perpetual contract funding rates remain negative and the buy-sell ratio falls below 1, the market has entered an "extremely bearish" state. In this environment, the whale's OTC cash-out seems more like a departure signal before the doomsday carnival - after all, historical data shows a 68% probability of a black swan event within 3 months of record open interest.
Chapter Four: Technical Indicators and Macroeconomic Variables
Examining the K-line pattern reveals hidden mysteries:
Volatility compression: Daily Bollinger Bands narrowed to 5%, the lowest since February 2024, signaling an imminent breakthrough;
Weekly paradox: Price stabilized above 50-week and 100-week EMA, but MACD histogram shows top divergence, with RSI of 42 suggesting insufficient upward momentum;
Fibonacci constraints: $2,800 daily closing price will become the long-short watershed, breaking through opens the theoretical space of $3,200-3,500, otherwise it may retest $2,500 to establish price support.
On the macro level, US-Russia geopolitical negotiations and Fed rate cut expectations create a double disturbance. CME rate futures show a 79% market pricing for 2-3 rate cuts in 2025; any deviation from the actual path will hit the crypto market first. Standard Chartered Bank warns that if the RWA (Real World Assets) narrative fails to materialize in Q3, Ethereum may face the risk of billions of dollars in market value evaporation.
Epilogue: On the Eve of Paradigm Revolution
Ethereum stands at a historical crossroads:
Staking economic reconstruction: Proposing EIP-7251 to raise validator node staking limit to 2048 ETH, optimizing exit mechanisms to alleviate liquidity crisis;
Layer2 value feedback: Forcing Arbitrum and other Layer2s to allocate part of fee income to mainnet, solving the paradox of "ecosystem prosperity, mainnet poverty";
Regulatory breakthrough: If SEC approves 21Shares staking ETF in Q3, expected to bring 15-20% short-term increase and lock 8% circulation.
As Peter Blunt says, after breaking through the $2,800 congestion pattern, Ethereum may initiate a "moon" trend to $5,232. But beware, the essence of this capital game is still a liquidity hunt driven by leverage - when $1.8 billion in short positions become fuel, the market will ultimately verify: who is riding the trend, and who is swimming naked.


