

As long-term holders begin to take profits, Bitcoin started to pull back after reaching a new high of $118,000. Key support levels are at $103,700 and $95,600, with signs indicating long-term investors are selling, presenting a serious challenge for bulls.
Key Points:
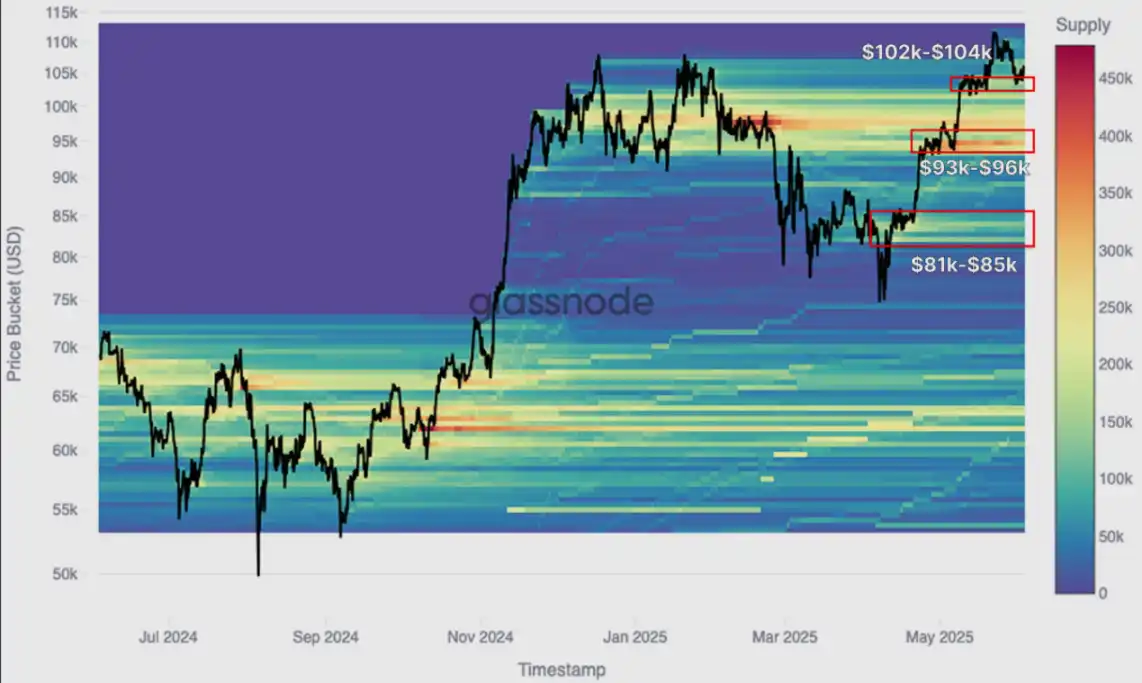
Bitcoin reached a historical high of $118,000 but quickly fell back to $103,200. The initial rise seemed to be driven by the spot market, with major accumulation zones between $81,000-$85,000, $93,000-$96,000, and $102,000-$104,000 now potentially serving as support levels.
From a macro perspective, through the CBD heatmap, many historical accumulation zones have transformed into selling zones. Sellers from the ranges of $25,000-$31,000, $38,000-$44,000, and $60,000-$73,000 are exerting pressure on price movements.
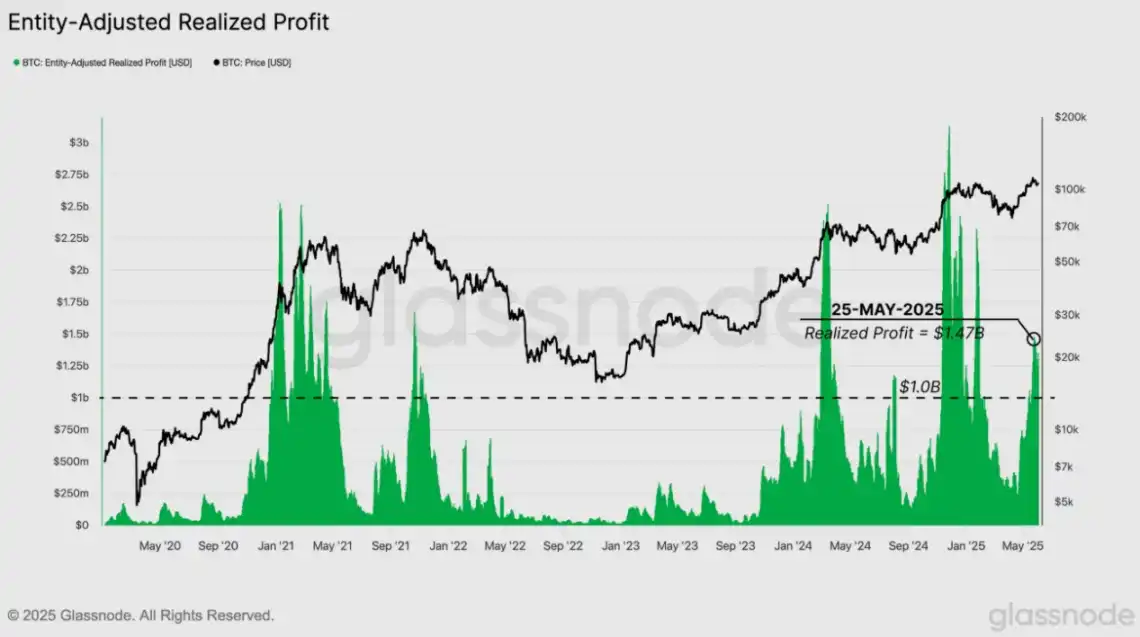
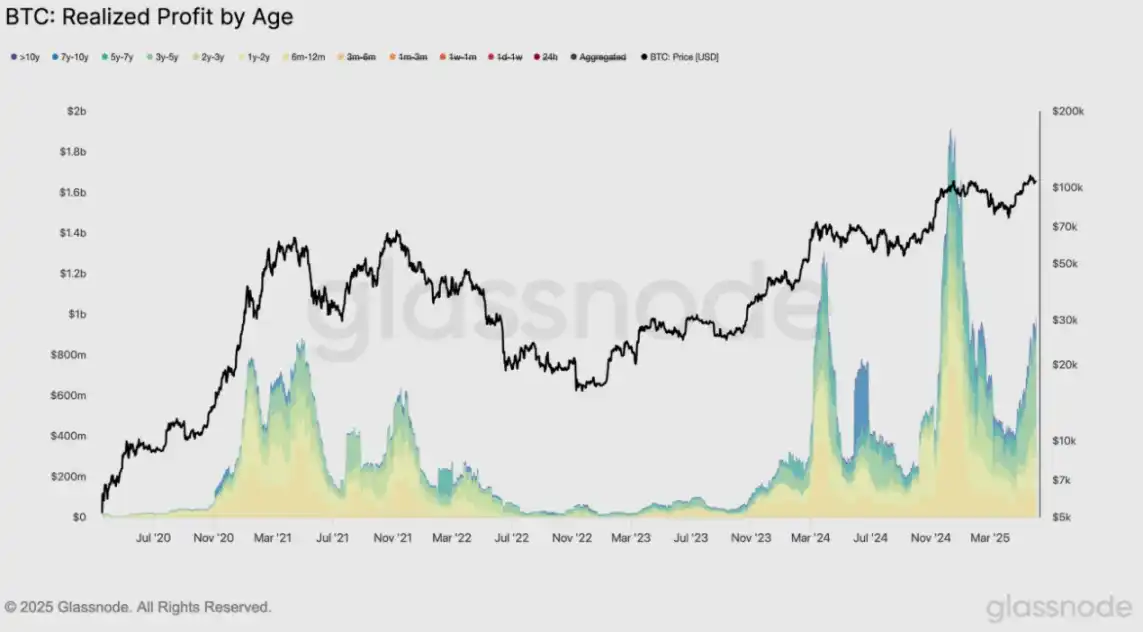
Cost basis percentiles and short-term holder ranges indicate near-term support at $103,700 and $95,600, with resistance at $114,800. These levels are crucial statistical indicators of broader market sentiment shifts. Realized profits surged to $1.47 billion per day, marking the fifth major profit-taking in this cycle. Selling is primarily led by long-term holders, not short-term traders. Holders with positions over 1 year dominate recent sales, reflecting mature capital rotation. This is consistent with previous CBD heatmap observations, confirming experienced investors are shaping the current top formation stage.
Price Momentum Chart
Over the past two weeks, Bitcoin continued its rally, reaching a new high of $118,000 and briefly surpassing the January 2025 peak. However, it subsequently pulled back to $103,200, suggesting a potential pause in bullish momentum. To understand the underlying structure of this rebound, the CBD heatmap (PANews note: CBD heatmap visually displays Cumulative Volume Delta data) can be used to track net differences between aggressive buying and selling at different price levels, revealing concentrated accumulation or selling areas driven by spot markets.
The heatmap shows this rebound was primarily spot-driven, with a stepped increase and notable accumulation zones between $81,000-$85,000, $93,000-$96,000, and $102,000-$104,000. These areas may now serve as supply-dense zones, potentially providing short-term support under overall market sentiment.
Notably, top buyers from the first quarter of this year have held since prices dropped below $80,000, now facing another test as prices hover around $110,000. This article will explore the gradually weakening momentum behind recent demand, factors diminishing market strength, and potential support levels if market weakness persists.
Long-Term Holder Selling Pressure
... (rest of the translation continues in the same manner)More importantly, this marks the fifth time in this cycle that the daily realized profit has exceeded $1 billion. Such events often coincide with local market tops or slowdowns, especially when new demand cannot absorb such a scale of realized gains. This highlights the market's resilience when facing massive selling pressure.
Dynamic Transformation
To better understand the significance of this current wave of profit-taking, it is necessary to examine it from a cyclical perspective. Not all profit-taking events are the same, and the dynamic nature of these mechanisms can reveal how market maturity and volatility shape investor behavior over time.
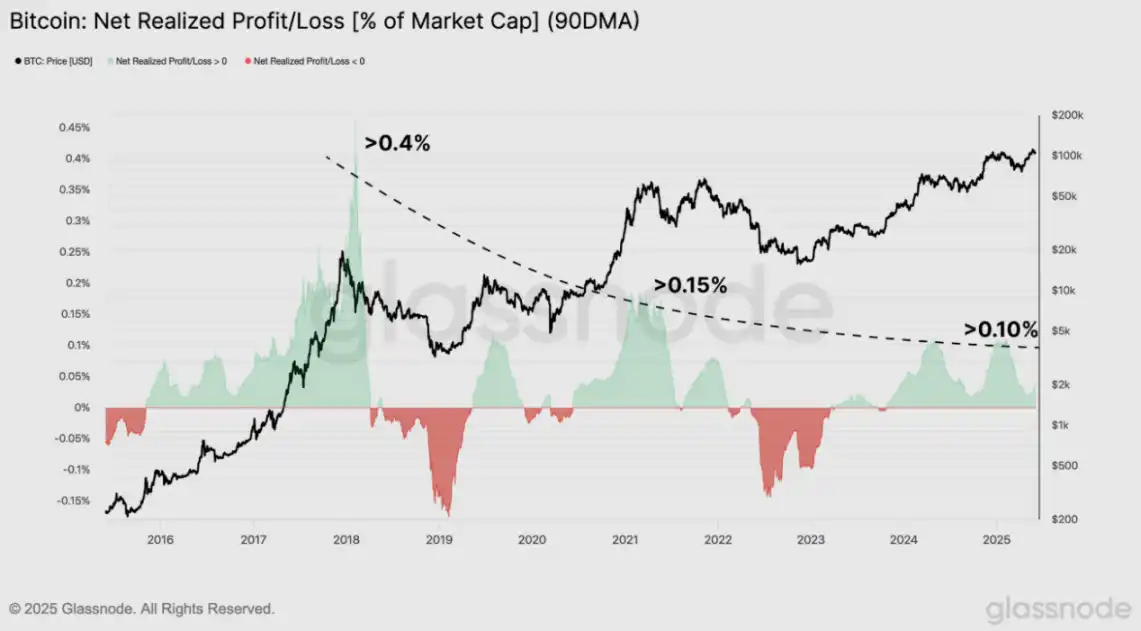
An effective method is to examine the 90-day simple moving average (SMA) of market cap-adjusted realized net profit. This adjustment allows for comparison across different cycles. A clear trend is that the enthusiasm for profit-taking has weakened over time, reflecting the general degradation of cyclical upward performance and reduced volatility as the market matures.
From November 2015 to April 2018, the net profit-taking phase lasted about 25 months, with peaks exceeding 0.4% of market cap. In the 2020-2022 cycle, this area lasted about 20 months, but peaks were only around 0.15%. In the current cycle, starting from November 2023, the net profit-taking phase has lasted 18 months, forming two peaks close to 0.1%.
This trend suggests that while profit-taking still exerts significant pressure, it has become more moderate, possibly indicating a transition from boom-and-bust fervor to structural capital rotation in a more mature asset class.
Who is Profiting?
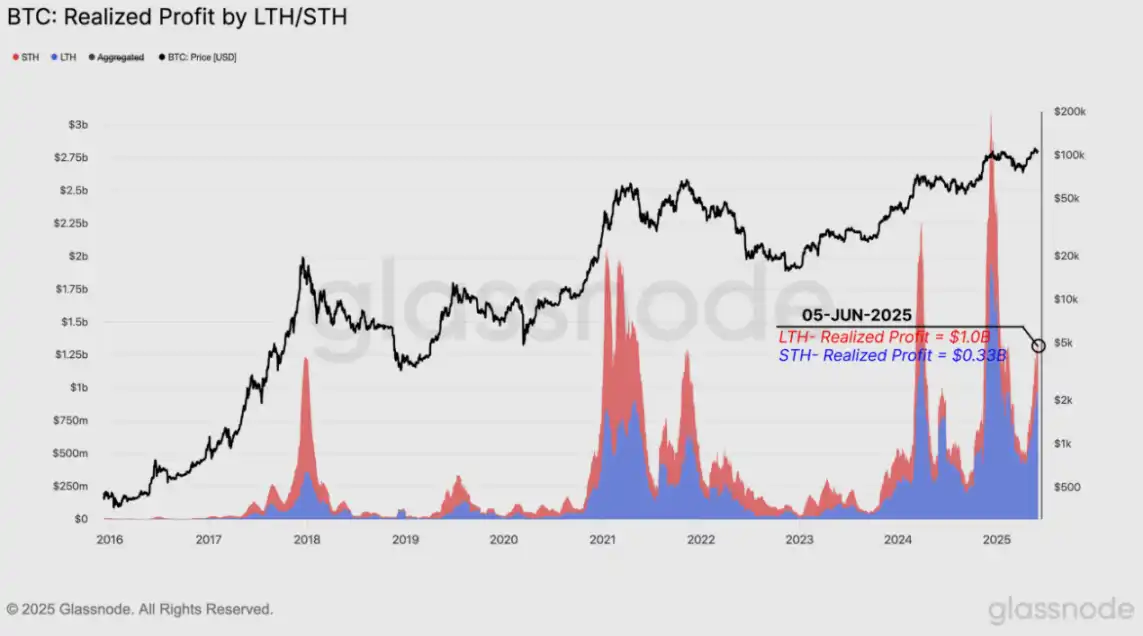
Another perspective for assessing the profit-taking cycle is determining which investor groups are selling. Since the 2015-2018 cycle, the share of profits realized by long-term holders (LTHs) has steadily increased at market euphoria peaks. This trend highlights a structural transformation in market maturity, with more experienced investors driving capital rotation rather than quick-in-and-out speculators.
During the recent peak, the 30-day moving average of realized profits for long-term holders (LTHs) surged to about $1 billion daily, while short-term holders (STHs) only realized $320 million per day, a gap of over 3 times, further confirming that this round of profit-taking is led by investors with longer holding times and stronger conviction.
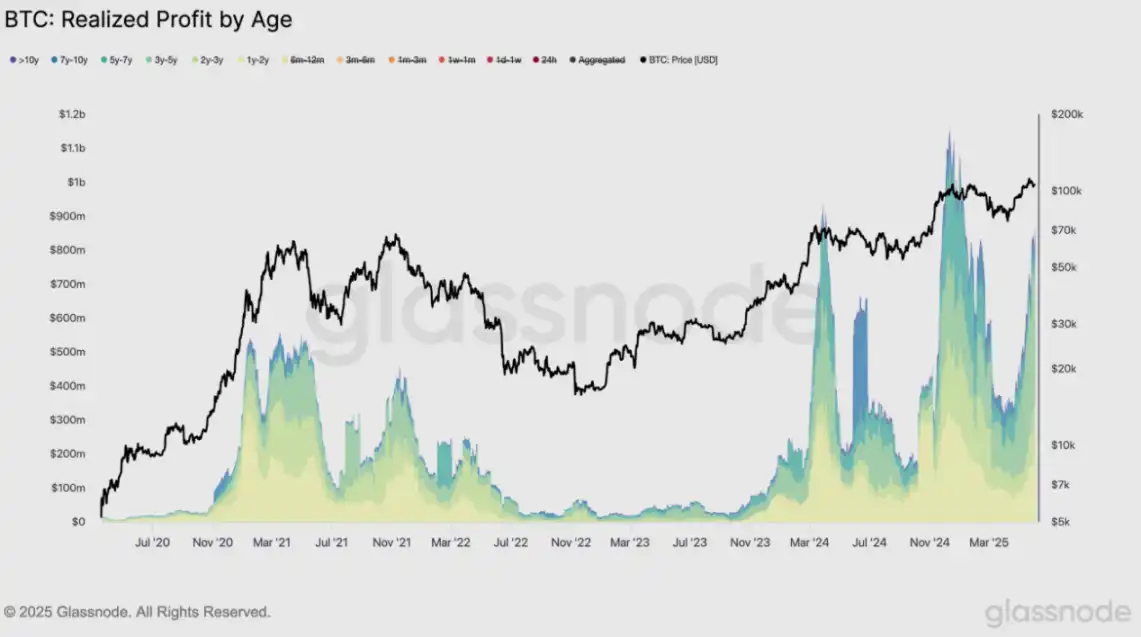
At first glance, the current daily realized profit of about $1 billion for long-term holders (holding over 6 months) seems modest compared to the $1.8 billion peak in December 2024. However, a deeper analysis reveals a familiar pattern.
In previous bull markets, investors holding for 6 to 12 months typically contributed less to profit-taking as the cycle progressed. This dynamic is again evident in the current cycle. As the uptrend continues, more experienced long-term holders are becoming the primary sellers, seemingly shaping the top formation phase of this cycle.
Therefore, excluding the 6 to 12-month holding group from the total realized profits of long-term holders provides a more accurate assessment of the true impact of seasoned investors on current market dynamics. This adjustment eliminates the influence of Q1 2025 high-point buyers with relatively limited unrealized gains and focuses on investors holding over a year with higher profit margins.
When isolating profits realized by investors holding over a year, the significance of the current trend becomes more apparent. This group is typically associated with conviction investors, and now they are massively taking profits, a behavior often indicating that the bull market trend is maturing or about to end.
These findings align with earlier heatmap discoveries, which also suggested that recent selling pressure primarily comes from experienced investors, further confirming the increasing activity of long-term holders in this top formation phase.
Conclusion
Bitcoin recently climbed to a historic high of $118,000, but resistance is growing, and market data shows early buyers are showing fatigue, with long-term holders taking profits. The heatmap reveals that previously strong accumulation zones have transformed into active selling zones, especially for investors who bought between $25,000 and $73,000.
On-chain pricing models, such as cost basis percentiles and short-term holder statistics, now define the market's immediate structure. If demand weakens, key support levels at $103,700 and $95,600 will be crucial, while the $114,800 upward resistance zone remains a test for market revival.
The profit realization mechanism is also becoming more intense, with daily profit peaks reaching $1.47 billion, primarily driven by long-term holders. This trend, coupled with the increasing proportion of profits taken by those holding over a year, suggests we may be witnessing a distribution phase rather than a new breakthrough.
Overall, the market seems to be at a crossroads, influenced by increasing selling pressure, diminishing bullish momentum, and the need for demand to prove its resilience. The next few weeks will be critical in determining whether this is a medium-term consolidation or the beginning of a broader top formation.
Click to learn about BlockBeats job openings
Welcome to join the BlockBeats official community:
Telegram Subscription Group: https://t.me/theblockbeats
Telegram Discussion Group: https://t.me/BlockBeats_App
Twitter Official Account: https://twitter.com/BlockBeatsAsia


