The market, project, cryptocurrency, and other information, opinions, and judgments mentioned in this report are for reference only and do not constitute any investment advice.

Written by 0xBrooker
Since the low point in April, BTC has rebounded by up to 50%, outperforming the Nasdaq and reaching a new historical high.
However, the significant short-term increase has also accumulated some selling pressure. Since May 22, the BTC market has begun to experience large-scale selling. This has put some pressure on BTC, which is at a high point and leading US stocks, becoming a source of downward momentum for BTC prices.
Unable to continue rising, BTC explored down to the $100,000 support level during market panic caused by Trump and Musk's conflict on Thursday. The price has since continued to rebound, returning above the "first upward trend line".
Accompanied by US stock adjustments, the buying power of the BTC Spot ETF channel has converged, making it difficult for BTC to absorb selling pressure and continue rising. However, it's worth noting that as the price adjusted, the exchange outflow scale also significantly increased this week, indicating that new funds are taking the opportunity to accumulate chips during the adjustment.
The positive non-farm employment data has created a good atmosphere for BTC's stabilization and rebound, but truly breaking through to a new level may still require more progress in "reciprocal tariff war", "cryptocurrency policy", or Federal Reserve interest rate cuts.
Policy, Macroeconomic, and Economic Data
This week, the US released non-farm employment data. In May, employment increased by 139,000, which is a new low since February but slightly higher than the market's expected 126,000. The US unemployment rate in May was 4.2%, as expected, and did not worsen.
The data performance slightly exceeded expectations, driving up the three major US stock indices and causing gold to fall.
In recent reports, we emphasized that US stock trading revolves around two main lines:
1. Pricing the US economic "soft landing", "hard landing", or recession based on economic and employment hard data. Currently, the market pricing is close to a "soft landing", meaning that after years of rapid growth and high inflation, the economy gradually slows to a sustainable growth level without severe economic recession or massive unemployment. The current economic and employment data align with this characteristic. Although GDP growth has slowed, it is intentionally cooled by the Federal Reserve. Inflation data is declining orderly, unemployment rate is stable, and new employment has not significantly dropped. Of course, this also means that Federal Reserve interest rate cuts will inevitably be delayed.
2. Predicting potential long-term economic and market changes caused by "reciprocal tariffs" and other government policies, and pricing them in advance through forward-looking trading. The market crash in early March and April was a forward-looking pricing of unexpected "reciprocal tariffs" and potential inflation and employment deterioration. The market rebound after April 7 was a forward-looking pricing of economic "soft landing" after Trump's attitude "softened". This forward-looking pricing includes the expectation that the "reciprocal tariff war" will end relatively moderately, not causing US inflation to worsen, not significantly impacting US corporate profits, and two 50 basis point rate cuts in the second half of the year.
In the May monthly report, we pointed out that the current market pricing is relatively optimistic, and short-term further upward pricing is too optimistic. In fact, there are still many uncertainties regarding the reciprocal tariff war.
In the past week, US and Chinese leaders had their first phone call since the tariff war, and while the subsequent statement emphasized respect and reciprocity and agreed that representatives from both sides will soon consult in the UK, it can be seen that they are still in the negotiation stage, far from signing an agreement.
As Trump raised steel and aluminum tariffs from 25% to 50%, the Canadian government also threatened retaliation.
In addition, other events that significantly impacted the market this week include Musk's public criticism of the "Beautiful Law" and Trump. Musk called the law "disgusting" and called on the public to pressure Senate members to block its passage. Trump threatened to cancel federal contracts with Musk's companies. This argument caused Tesla to experience its largest single-day drop in history and triggered a sharp drop in US stock indices and BTC. However, this conflict is currently an isolated incident and unlikely to significantly affect market trends for an extended period.
Overall, driven by slightly better-than-expected non-farm data and slowly but steadily progressing "reciprocal tariff" negotiations, US stocks, US bonds, and the US dollar maintained a fragile balance and slightly tilted towards optimism in the past week.
Crypto Market
Since the rebound in April, BTC's trend has led the Nasdaq. US stocks are preparing to impact previous highs, while BTC has already set a new historical high on May 22.
From a technical indicator perspective, after rebounding to a new high, BTC has undergone a two-week adjustment. Last week, it pulled back by 3.07%, and this week, it fluctuated significantly with a micro-increase of 0.08%, showing a long-tailed cross on the weekly chart. During this adjustment, volume has been in a state of contraction.
The maximum two-week pullback was around 10%, overall within the "Trump bottom", with the lowest day being Thursday's retracement to the "first upward trend line".
This adjustment after BTC set a new high before US stocks reach a new high is foreseeable and considered healthy. A certain period of oscillation is inevitable, and breaking to a new high may require more progress in "reciprocal tariff war", "cryptocurrency policy", or Federal Reserve interest rate cuts.
Selling Pressure and Selling
Since rebounding from the depths of despair in April, BTC has recorded a maximum increase of 50%.
With the new historical high record, both short-term dip buyers and long-term investors still in shock have shown some selling. This selling pressure peaked on May 22 and has since gradually decreased.

On-chain realized profits have been declining since May 22
It's worth noting that as selling decreases, centralized exchange outflows have been increasing. This week's outflow reached 76,520.72 coins, far higher than the usual weekly 1-2,000 coin outflow. This significant outflow can be seen as strong recognition of current prices by long-term funds.
Capital Inflow and Outflow
After achieving stage profits, even profit-taking has occurred in the ETF channel funds.
In the past two weeks, the BTC Spot ETF channel has experienced small fund outflows, with 135 million last week and 128 million this week. These outflows occurred during BTC's significant rise and US stock volatility.
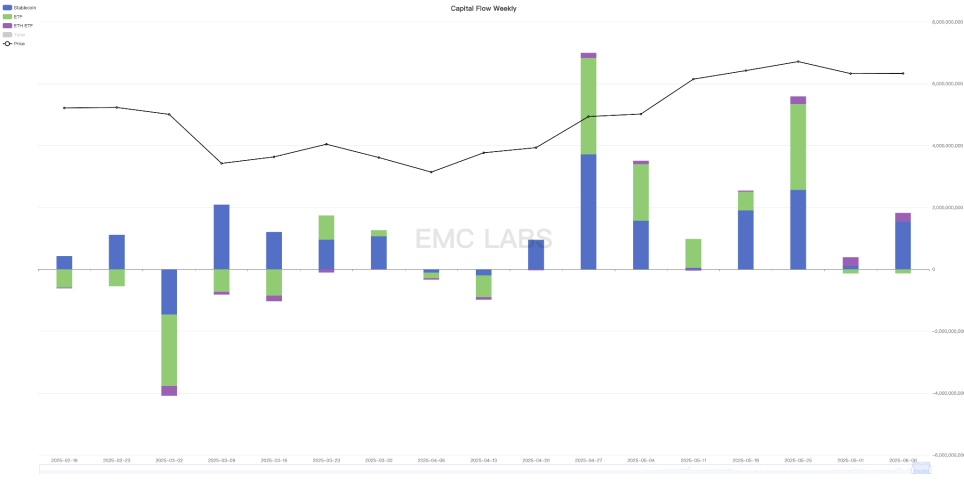
Stablecoin and ETF channel fund inflow and outflow statistics (weekly)
Viewed in isolation, it's difficult to estimate when this channel's funds will return to inflow. However, considering the overall US stock trend, we believe excessive worry about significant downward exploration is unnecessary. Although technically there's a possibility of retesting $100,000, the difficulty of grasping this is high. In the fragile supply and demand balance, a breakthrough rise might occur within a day or two.
Cycle Indicators
According to eMerge Engine, the EMC BTC Cycle Metrics indicator is 0.625, in an upward phase.

EMC Labs was created by crypto asset investors and data scientists in April 2023. Focusing on blockchain industry research and Crypto secondary market investment, with industrial foresight, insight, and data mining as core competencies, committed to participating in the booming blockchain industry through research and investment, and promoting blockchain and crypto assets' benefits to humanity.
For more information, please visit: https://www.emc.fund