

As long-term holders begin to take profits, Bitcoin started to pull back after reaching a new high of $118,000. Key support levels are at $103,700 and $95,600, with signs indicating long-term investors are selling, presenting a serious challenge for bulls.
Key Points:
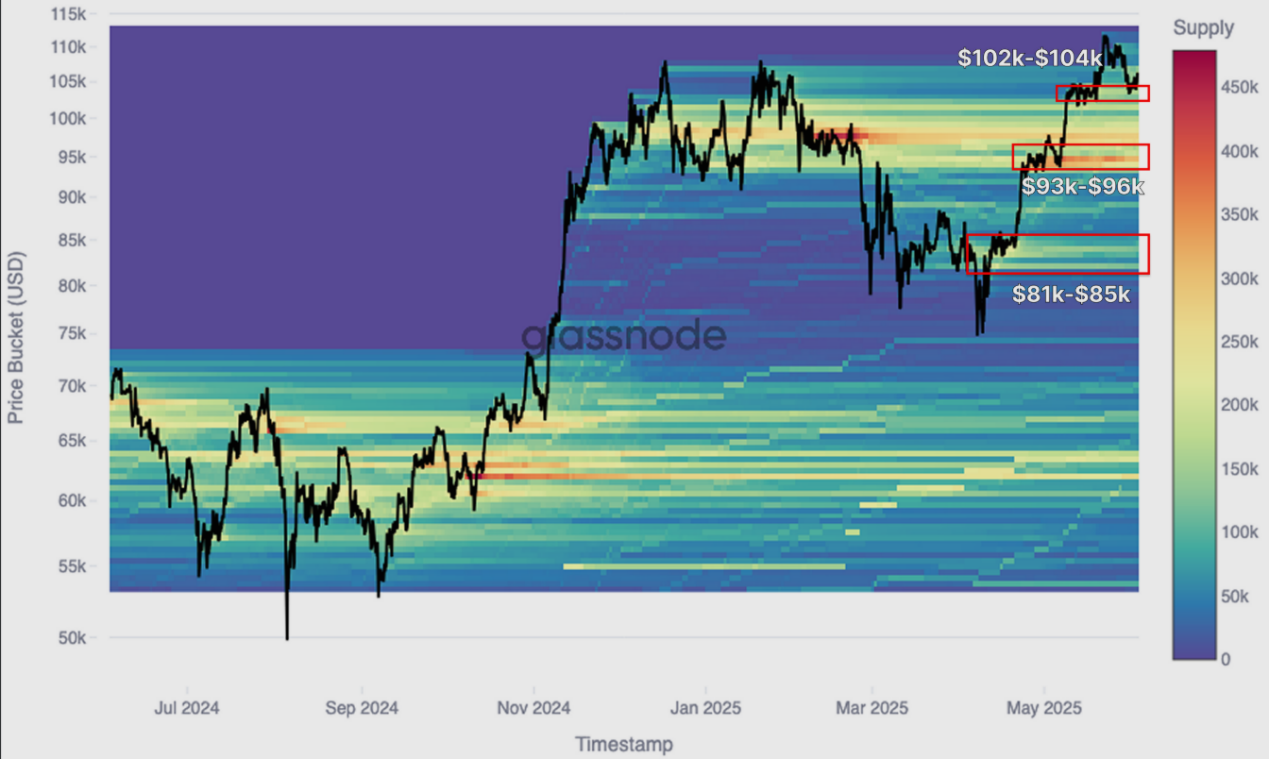
- Bitcoin reached a historical high of $118,000 but quickly fell back to $103,200. The initial rise seemed to be driven by the spot market, with major accumulation zones at $81,000 to $85,000, $93,000 to $96,000, and $102,000 to $104,000, which have now become potential support levels.
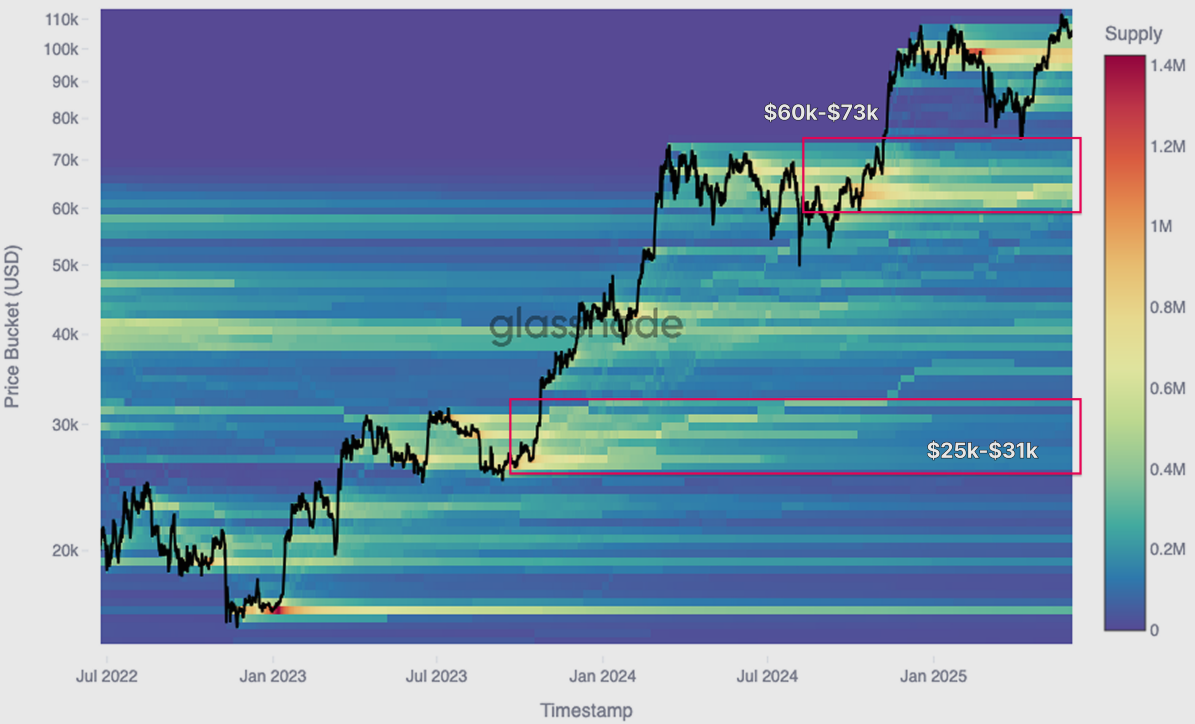
- From a macro perspective, through the CBD heatmap, many historical accumulation zones have transformed into selling zones. Sellers from the ranges of $25,000 to $31,000, $38,000 to $44,000, and $60,000 to $73,000 are putting pressure on price movement.
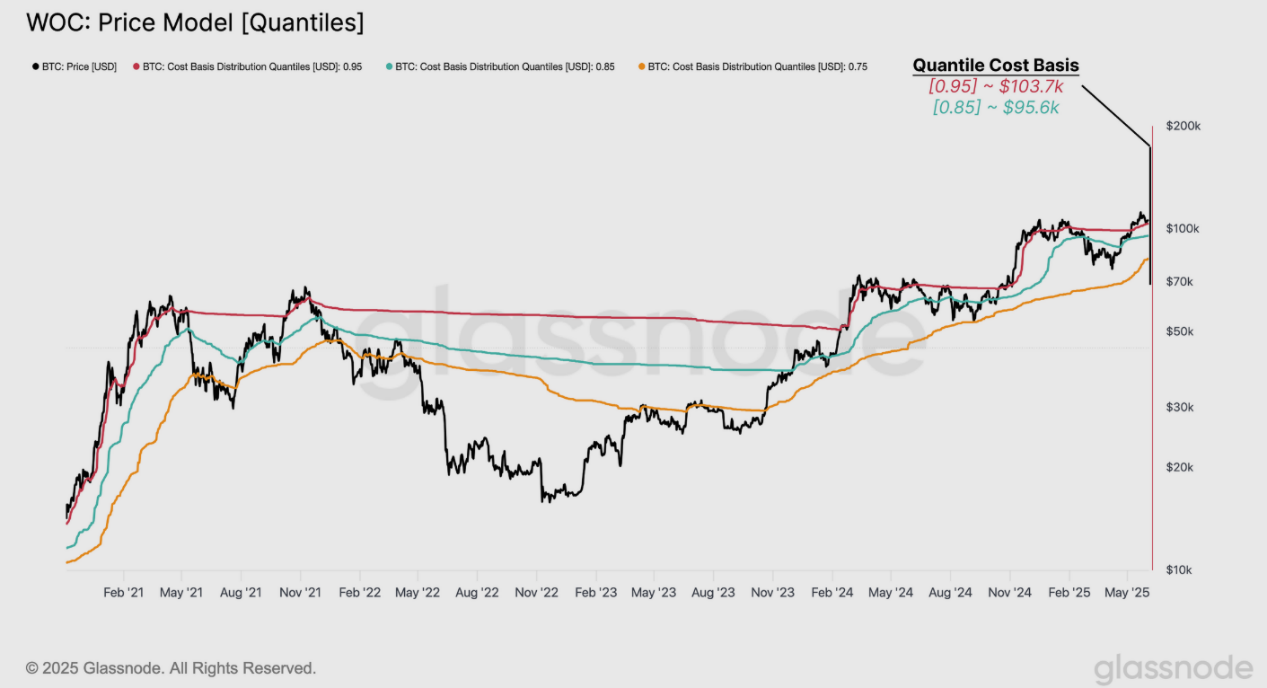
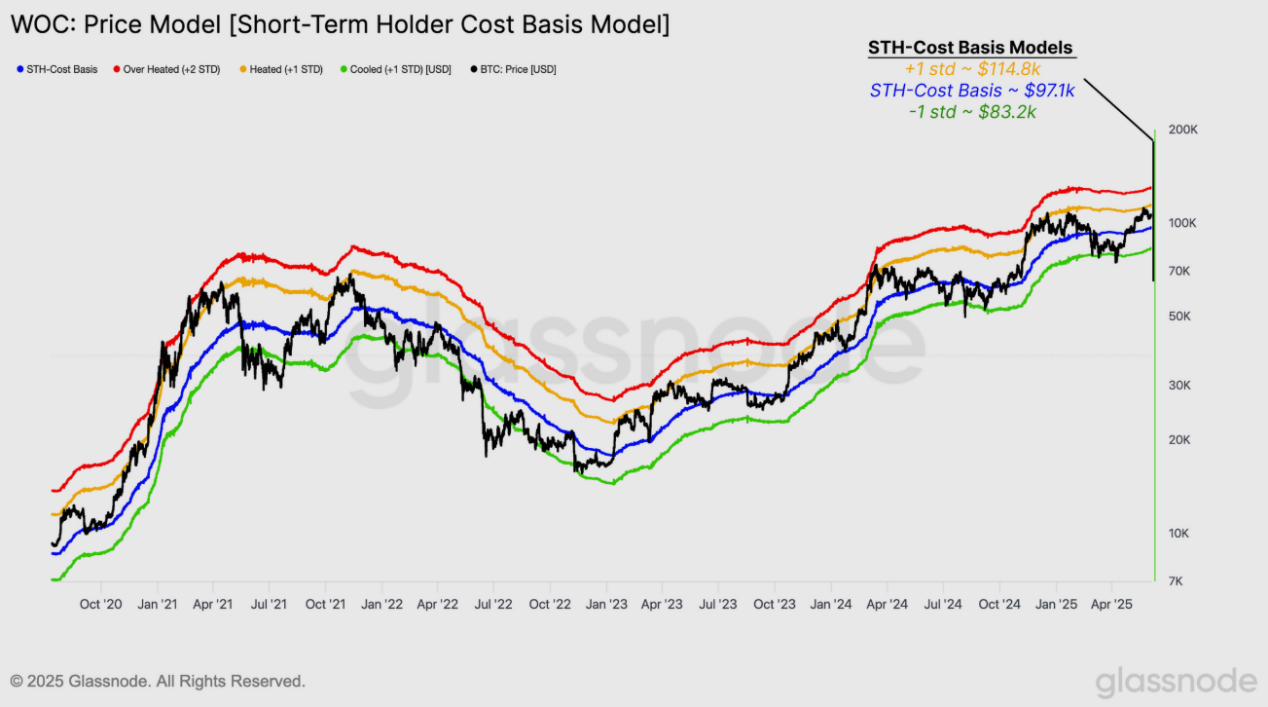
- Cost basis percentiles and short-term holder intervals indicate near-term support at $103,700 and $95,600, with resistance at $114,800. These levels are important statistical indicators of broader market sentiment shifts.
- Realized profits have surged to $1.47 billion per day, marking the fifth major profit-taking in this cycle. Selling is primarily led by long-term holders rather than short-term traders.
- The group holding for over a year dominates recent selling, reflecting mature capital rotation. This is consistent with previous CBD heatmap observations, confirming experienced investors are shaping the current top formation phase.
Price Momentum Ladder
Over the past two weeks, Bitcoin continued its upward trend, reaching a new high of $118,000 and briefly surpassing the January 2025 peak. However, it subsequently pulled back to $103,200, suggesting a potential pause in bullish momentum.
To understand the internal structure of this rally, one can use the CBD heatmap (PANews note: CBD heatmap visually displays Cumulative Volume Delta data), which tracks the net difference between aggressive buying and selling at different price levels. Visually, it reveals concentrated accumulation or selling areas driven by spot markets, helping identify the most robust demand intervals.
The heatmap shows this rally was primarily spot-driven, with a step-like ascent, featuring clear accumulation zones between $81,000 to $85,000, $93,000 to $96,000, and $102,000 to $104,000. These areas may now serve as supply-dense zones, potentially providing short-term support under overall market sentiment.
Notably, top buyers from the first quarter of this year have held since prices dropped below $80,000, and now face another test as prices hover around $110,000. This article will explore the gradually weakening momentum behind recent demand, factors diminishing market strength, and potential support levels if market weakness persists.
Source: glassnode
Long-Term Holder Selling Pressure
To understand the driving force behind Bitcoin's recent breakthrough to $111,000, a broader market structure perspective is necessary. By examining the heatmap since the June 2022 cycle bottom, the distribution pattern of past accumulated positions becomes clear.
As prices continue to rise, previously accumulated supply-dense zones (typically characterized by lateral consolidation) have now transformed into active selling areas. Visually, the heatmap shows a progressive transformation; areas that once supported the upward trend have become resistance levels as early holders take profit opportunities.
The most significant selling pressure comes from groups that accumulated positions in key historical ranges ($25,000 to $31,000 and $60,000 to $73,000). Many in these groups have experienced multiple volatility phases and are now intensifying supply overflow, seemingly limiting Bitcoin's further ascent in the short term.
Source: glassnode
Price Discovery Exploration
As long-term holders gradually apply selling pressure, the likelihood of a short-term pullback continues to increase, especially without strong catalysts to firmly break through $118,000. During this phase of stalled bullish momentum, on-chain pricing models become crucial tools for identifying potential support levels during a correction.
One particularly effective framework is the Spent Supply Distribution (SSD) percentiles. This indicator analyzes the cost basis of tokens at specific times, dividing them into 100 percentiles. It provides a high-resolution view of where supply initially entered the market, enabling identification of areas with high turnover, potentially driven by profit-taking or loss realization.
The focus here is on three key percentiles:
- 🔴 0.95 (top 5%)
- 🔵 0.85 (top 15%)
- 🟠 0.75 (top 25%)
Historical patterns over the past five years indicate that when prices are above the 0.95 percentile, absolute euphoric sentiment often emerges, while sideways bull market stages typically occur between 0.85 and 0.95. Conversely, sustained levels below 0.75 usually signify bear markets or risk-off periods.
Currently, the 0.95 percentile is around $103,700, representing the first on-chain support level. If selling pressure persists, the next level to watch is the 0.85 percentile at $95,600, which may provide structural support or, if breached, confirm a broader risk reset.
Source: glassnode
Over the past six months, Bitcoin supply has significantly changed hands, driven by two historical highs, making tracking recent investor behavior increasingly important. One of the most insightful models is the Short-Term Holder (STH) cost basis, reflecting the average purchase price of Bitcoin held for less than 155 days.
To refine the statistics, "standard deviation bands" are applied to this cost basis to define key support and resistance areas. These standard deviation channels help quantify the range of short-term participants' market consensus and may signal trend exhaustion or breakthrough thresholds.
Currently, the STH cost basis is $97,100, representing recent buyers' average purchase price. +1 is typically associated with overbought or bullish breakthrough conditions, positioned at $114,800, while -1 is at $83,200, signaling increased downside risk.
These three levels ($114,800, $97,100, and $83,200) now define the statistical boundaries of short-term market sentiment. Breaking through or falling below these thresholds will likely determine the market's next phase, indicating whether momentum is strengthening or weakening.
Source: glassnode


