

In the past two days, the market has been volatile. #BTC has dropped about 4% from its high and has returned to the first support level previously consolidated, with a slight rebound. However, divergences remain significant. Although it has been above the 5-day moving average on the 4-hour to 24-hour cycle, it continues to oscillate along the line, making it difficult to open up upward space, and Altcoins are even more hesitant to follow.

A few days ago, #ETH once surged strongly, with E-guards full of vigor. However, this wave is actually a typical false breakout, fortunately choosing to short at the time. From the cycle pattern, 2800 was not effectively broken, meaning it is difficult to attack 4000. If it cannot go up, it will naturally explore downward. The support below is around 2118, and it is recommended to place orders for spot trading in the 2250-2118-2000 range in batches.

Currently, the operation is still mainly short on rebounds. The weekly line has consecutive long upper shadows for multiple weeks, indicating that there is a large amount of capital fleeing above 2500, with obvious pressure. In comparison, many #Altcoins have fallen back to their starting points, reflecting that the current Altcoin risk is far higher than before and requires increased vigilance. Overall, going long currently requires courage and patience, while going short is relatively easier.
At the macro level, market sentiment is cautious. On one hand, the expectation of June interest rate cuts has weakened, and on the other hand, the Ukrainian drone attack on the Russian air base has once again escalated the geopolitical situation, increasing short-term uncertainty. In the absence of a clear upward signal, the market is in an adjustment phase, and during such periods, going short usually has an advantage.
Back to market dynamics! After three years, Musk mentions Bitcoin again! How will the market develop?

Observing the trend and on-chain data of $CA in the past two days, the recent decline is mainly due to large investors who FOMO'd in near 0.02 choosing to cut losses. Below 0.01, a large number of new addresses have continuously established positions, clearly showing new funds are re-accumulating at low levels.

Today, with the public announcement of the #WLFI event, the $CA price quickly rebounded to around 0.01, basically indicating that the accumulation and washing phase is near its end.
After covering the key points, let's look at the trends of several Altcoins
SUI
From the daily chart, after breaking through the bearish flag pattern, the price quickly rose by 16.28%, reaching a high of 4.04. Currently oscillating in the 3.2 to 3.3 range, waiting to confirm if it can break through the 4.09 resistance. If successful, it may explore up to 4.35. However, if it is under pressure and falls back, it may drop to 3 in the short term. The current volatility range is from the high of 4.35 to the low of 3, with an average of about 4.00.

In the medium to long term, Sui Network plans to unlock tokens worth 3.2 billion by the end of 2025. If bullish sentiment continues, #SUI may create a new all-time high, with a target price of 7.01; if there is a stage adjustment, the callback low point may be around 3.84, with an expected average price of 5.42 in 2025.
BNB
Binance Coin (#BNB) is currently trading at around 653.09. After experiencing a bullish surge on the daily chart, it is currently hovering near the overbought area. The key short-term resistance is at 707.25. If successfully broken, it may further rise to 730.52, or even challenge the new high of 801.25. The formation of the golden cross, BSC chain trading volume breaking 1 billion, and upgrades like Pascal, Lorentz, and Maxwell all provide strong support for BNB to create a new ATH.

Looking ahead to 2025, with the highly anticipated Altcoin season approaching and the continuous expansion of the Binance ecosystem, BNB is expected to challenge the 1,000 mark. If the upward trend continues, its price may reach a maximum of 1,292 USD, with a minimum of 761, and an expected annual average of around 926.
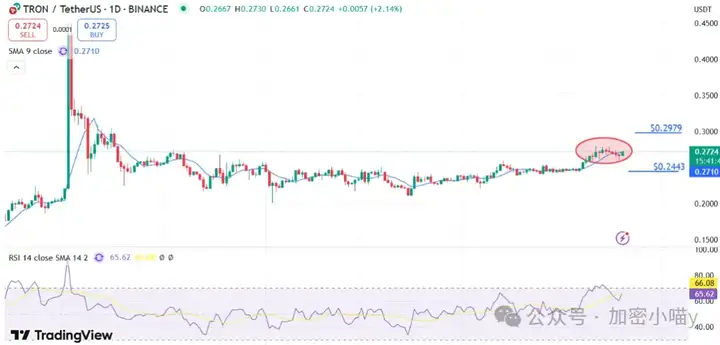
TRX
The daily chart shows its price is in a consolidation phase, forming a strong support around 0.27. If it can maintain this area and rebound, it may short-term rise to 0.2979, further challenging the 0.3 mark. However, the current RSI is at 66.08, suggesting a possible technical correction. If the trend weakens, #TRX may fall back to the support level of 0.2443. From a fundamental perspective, the growth of the DeFi ecosystem and features like gasless transactions provide support for price increases. Additionally, the 30-day moving average of daily transaction count has increased by 95% to about 8.4 million, showing a significant increase in activity.
Looking forward, in an optimistic scenario, TRX is expected to remain above the 0.70 psychological level and explore the 0.73 USD volatility high point; if it encounters a pullback, the price may drop to 0.39, with an expected annual average of 0.56 USD.
The article ends here! If you are lost in the crypto market, consider joining me in layout and harvesting from market makers! You can join the community (WeChat+QQ group: 3806326575 or WeChat: Mixm5688) without threshold, get market analysis, individual coin recommendations, and favorable news, layout in advance, and have irregular live market analysis! You can also ask questions in the group and get the best answers!


