

Bitcoin (BTC) has dropped 6% over the past 8 days after reaching an all-time high. Recent technical signals suggest increasing market uncertainty. The temporarily reduced whale activity is beginning to recover, implying that some large holders may start accumulating again.
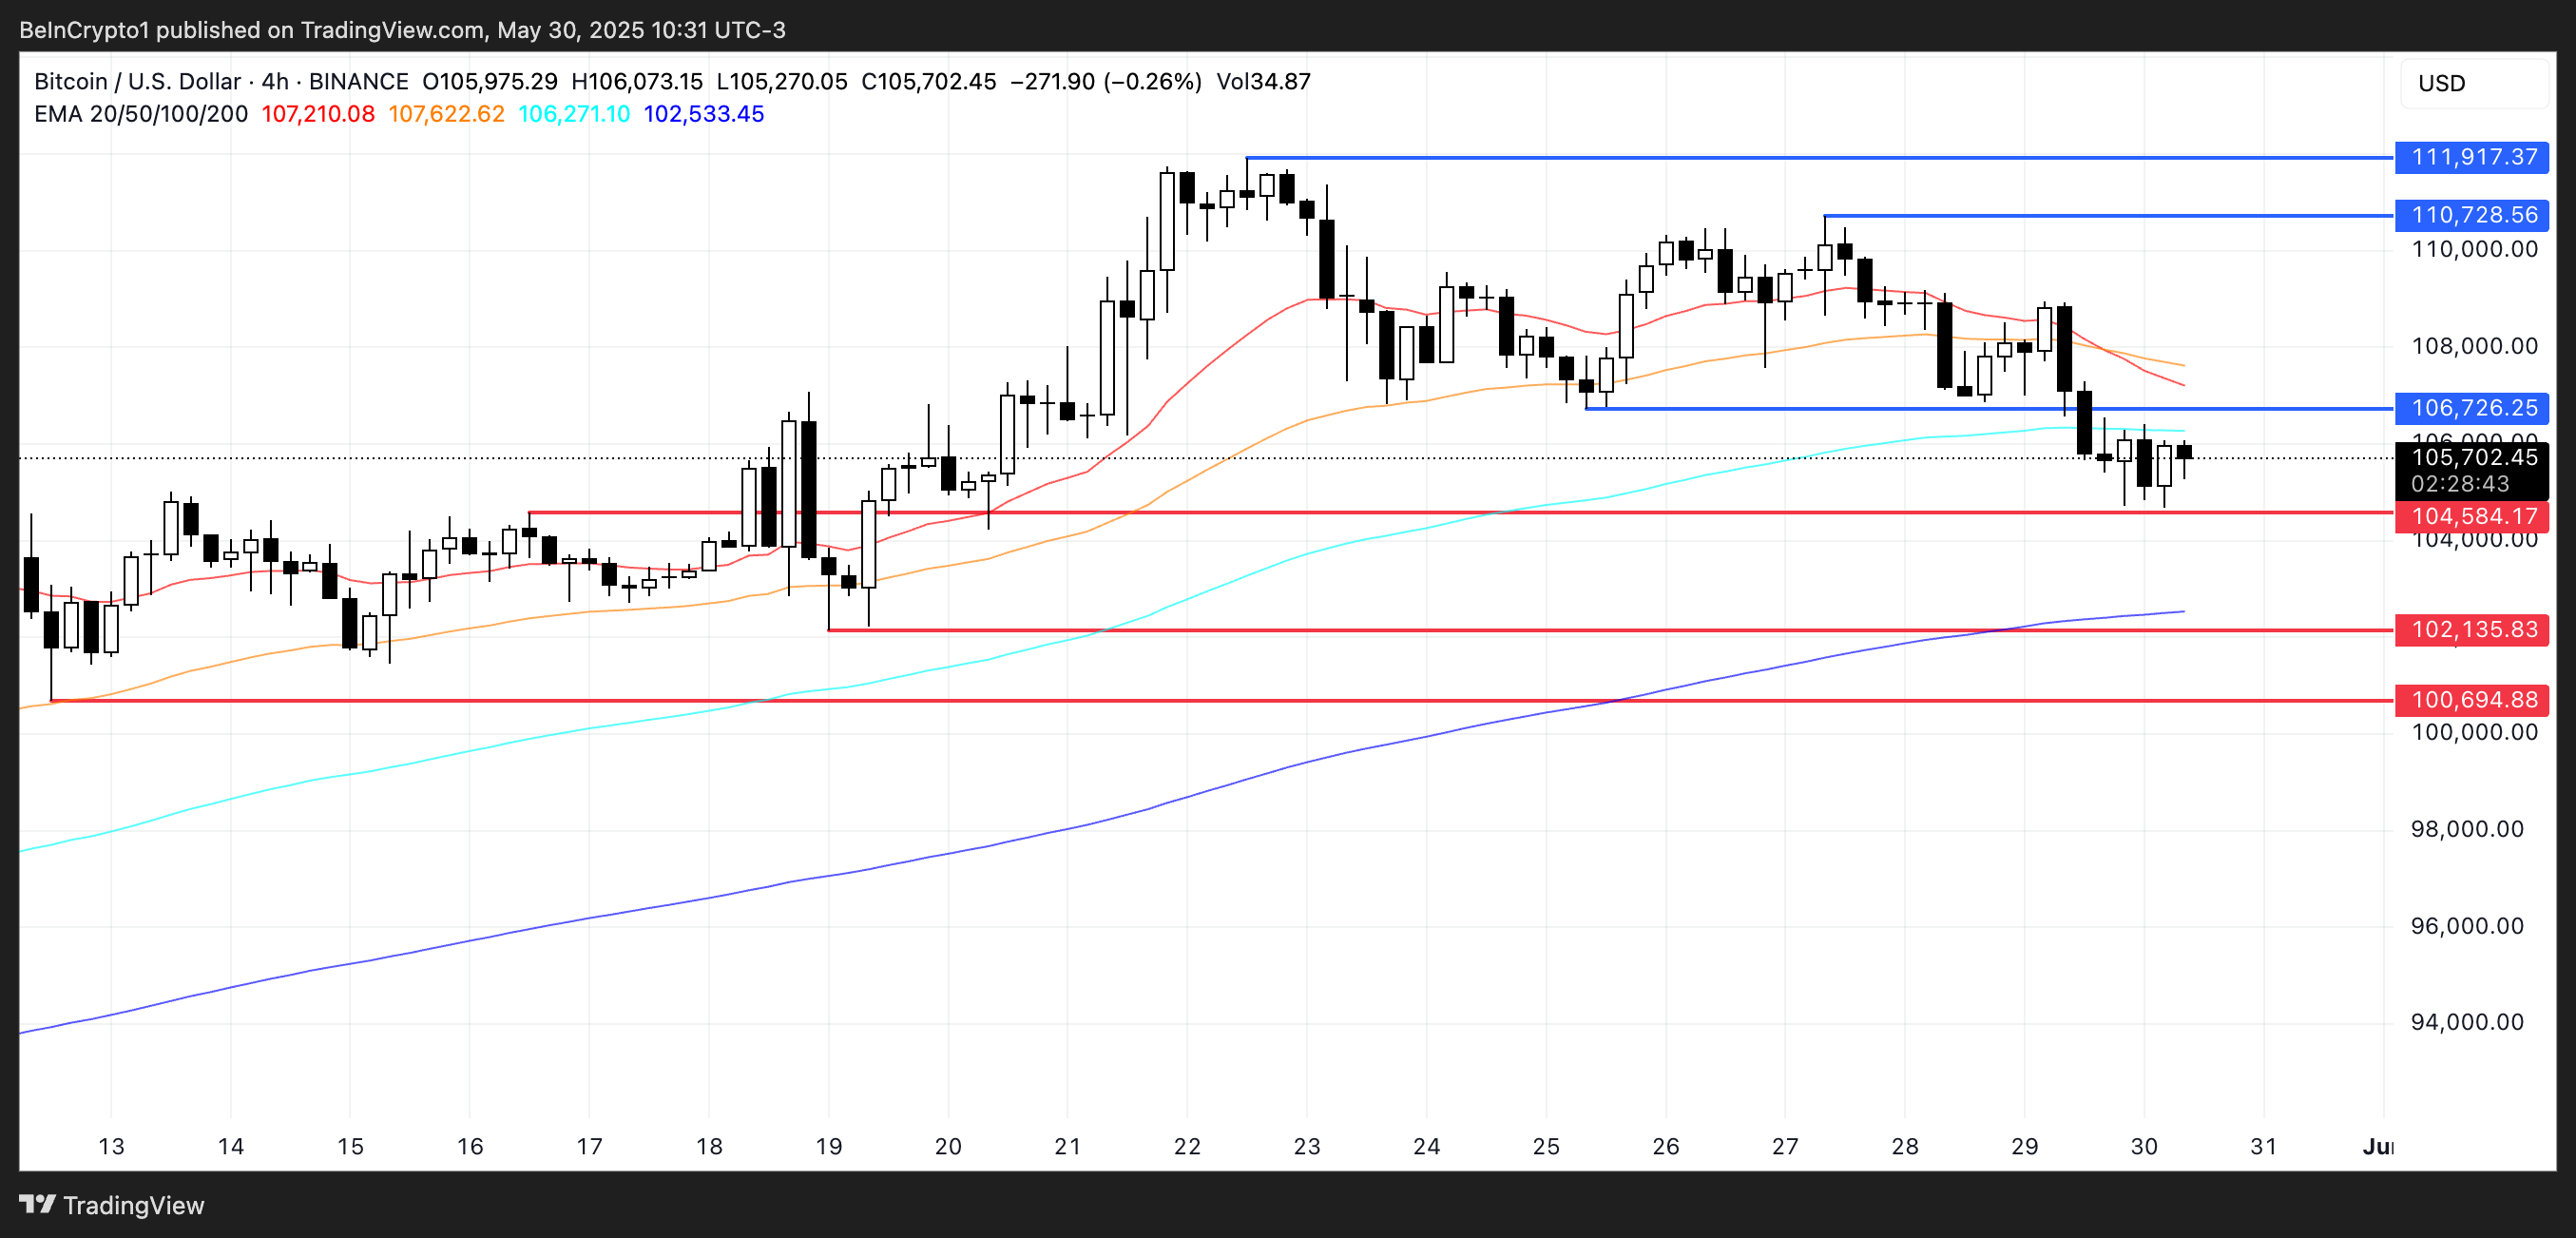
However, the Ichimoku chart is showing weakness, and BTC is trading below key support levels. With the price hovering just above $104,584, there remains a threat of another death cross and deeper decline unless bulls recover momentum above resistance.
Number of Bitcoin Whales Rebounds After Significant Decrease
The number of Bitcoin whales decreased to 2002 early this week before slightly rebounding to 2006.
This brief decline followed a sharp reduction from 2021 on May 25th, indicating a short-term decrease in large holders. However, the recovery suggests that some whales may start accumulating again.
Though the changes were small, these shifts could signal potential changes in market sentiment or price movements and are being carefully monitored.

Monitoring whale behavior is important due to its significant impact on Bitcoin's liquidity and volatility. A decrease in whale numbers can indicate profit-taking or distribution, often signaling caution or potential market cooling.
Conversely, the current stabilization or increase can help alleviate investor concerns and support price resilience at higher levels.
The recovery of large holder numbers after a sharp decline may indicate restored confidence among key players, potentially reducing the risk of immediate mass selling pressure and helping Bitcoin maintain its current range.
Technical Indicators Turning Bearish… BTC Struggling Below Key Levels
Bitcoin's Ichimoku chart shows a short-term bearish structure.
Price movement is currently positioned below the cloud (Kumo), indicating Bitcoin is trading in a bearish zone relative to historical and expected momentum.
The future cloud is red, suggesting the trend bias remains bearish in the near future unless the upper boundary is breached.

The conversion line (blue line) is below the base line (red line), confirming short-term downward momentum. Both lines are sloping downward, which is another bearish signal.
The lagging span (green line) is below both price and cloud, further reinforcing the lack of bullish momentum confirmation.
The future cloud is also narrowing, potentially indicating a potential balance or adjustment zone. Currently, the Ichimoku components align with a bearish outlook. A bullish reversal would require the price to break above the cloud and change the future cloud from red to green.
Bitcoin's Death Cross Possibility
Bitcoin price has recently formed a death cross, and technical indicators suggest another death cross may be approaching. The price is currently trading just above the critical support level of $104,584, which has acted as a short-term bottom.
If this support fails, the next downward target is $102,135, and selling pressure could drive it down to $100,694.
The presence of consecutive death crosses and weakened price movement near these levels increases the likelihood of a deeper correction in the short term.
On the bullish side, if Bitcoin can achieve recovery and build strong momentum, it could retest the resistance at $106,726.
Breaking this level could trigger a sharp move to $110,728, and if the rally accelerates, it might reach $112,000.


