

The market, project, currency, and other information, views, and judgments mentioned in this report are for reference only and do not constitute any investment advice.
Written by 0xBrooker
The first contact between the US and China in Switzerland has yielded major results, marking significant progress in the third phase of the "tariff war".
US stocks and the crypto market quickly cleared the negative pricing of the "tariff war", with speed and magnitude exceeding expectations.
Market traders are beginning to trade with a new paradigm - gambling on whether the US economy and employment will experience a recession and when the Federal Reserve will appropriately restart rate cuts.
This week's inflation and employment data showed continued inflation decline and temporary employment stability - the tariff impact was lower than expected.
After unexpected data input into a new trading framework, this pushed US stock indexes to rise significantly during the week, while gold plummeted.
This week, Federal Reserve Chairman Powell mentioned re-examining the "monetary policy framework" during an important speech, which may quickly restart the rate cut cycle. However, Fitch's downgrade of US Treasury bonds from Aaa to Aa1 again indicates that long-term risks still loom over US debt.
Policy, Macrofinance, and Economic Data
The biggest variable in financial markets over the past months, the "tariff war", underwent a major change on May 12th. After US-China contact in Switzerland, they announced a 90-day temporary tariff reduction agreement. The US will reduce tariffs on Chinese goods from a maximum of 145% to 30%, including a 20% "fentanyl tariff" and a 10% base tariff. China will reduce tariffs on US goods from a maximum of 125% to 10% and suspend or cancel non-tariff countermeasures implemented since April, such as rare earth export restrictions.
Previously, we noted that the tariff war had entered its third phase. This initial agreement between the US and China signifies major progress in the third phase. Combined with Trump's subsequent announcement that he cannot negotiate with 150 countries individually, we tend to judge that the tariff war's impact is gradually passing and may not create an unexpectedly significant impact on the global economy in the short term.
This should be the reason US stock traders went long throughout the week, rapidly pushing the three major stock indexes significantly higher. For the week, the Nasdaq, S&P 500, and Dow Jones indexes rose 7.15%, 5.27%, and 3.41% respectively, with all three indexes achieving four consecutive weeks of gains. If rate cut expectations increase, they might break through historical highs in the short term.
This week, the US released April CPI data, with seasonally adjusted monthly CPI at 2.3%, lower than expected and marking a third consecutive monthly decline. Employment data released on the 15th showed initial jobless claims at 229,000, in line with expectations. The Producer Price Index (PPI) was 2.4%, slightly lower than expected. The combination of multiple data points indicates that the tariff war has not yet caused hard data damage to consumption, and with inflation declining, restarting rate cuts is becoming the best choice.
Powell stated in his speech this week that the monetary policy framework introduced in 2020 (centered on a 2% average inflation target, allowing moderate inflation overshoot to support employment) is no longer fully applicable in the current economic environment. He mentioned that frequent supply shocks (such as the tariff war and supply chain issues) make the average inflation target difficult to manage, and policy adjustments are needed to better balance inflation and employment goals. In the framework used by the Federal Reserve in recent years, action was often taken only when the CPI average over a period approached 2%. The mentioned re-examination might enable action based on shorter-term or even single-month CPI data. This will undoubtedly enhance flexibility in responding to data fluctuations caused by frequent policy adjustments in the Trump administration. Under the new framework, current CPI data is already very close to meeting rate cut requirements.
The Federal Reserve's reaffirmation of the monetary policy framework may have deeper reasons, namely the US debt issue. Alongside rising US stocks, 2-year and 10-year US Treasury bond yields rebounded this week to highs of 4.0140 and 4.4840.
According to analysis, the US will add $1.9 trillion in new debt this year, with potential rollover scale reaching $9.2 trillion, of which $6.5 trillion is due in June alone. If rate cuts are not quickly initiated, not only will the US government continue to bear high interest rates, but it may also face auction challenges in the primary market. As a "gray rhino", massive debt will continue to plague the US government and become the most important variable affecting its political, economic, and financial policies. We judge that the Federal Reserve's adjustment of the monetary framework is fundamentally driven by debt and potential debt-related crises.
On May 16th, rating agency Moody's downgraded the US government's long-term issuer and senior unsecured debt rating from Aaa to Aa1. This is Moody's first downgrade of US Treasury bonds since 1917 and marks the loss of the highest credit rating from all three major rating agencies (S&P, Fitch, Moody's). Previously, S&P downgraded the US rating to AA+ in 2011, and Fitch did the same in 2023.
The debt "gray rhino" has become the most important indicator affecting US interest rates and financial market stability in the medium to long term.
Crypto Market
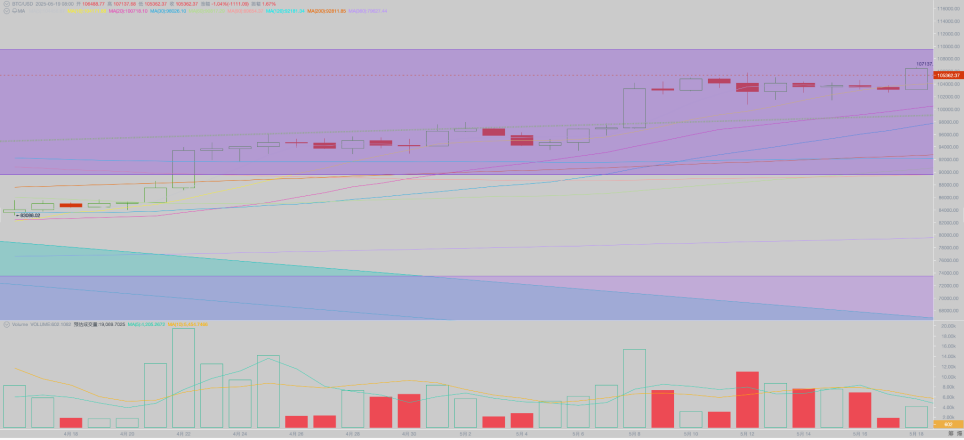
Previously, BTC led US stocks in clearing the "tariff war" pricing, approaching near previous highs. After US stocks rose significantly this week, it mostly maintained high-level consolidation, suddenly surging to $106,692.97 on Sunday, ultimately closing the week up 2.24%.
On technical indicators, it ran above the "first upward trend line" throughout the week, approaching the upper limit of the "Trump bottom". Overbought indicators were somewhat repaired. Volume was similar to the previous week.
Capital Inflows and Outflows
This week, the entire market maintained relatively robust capital inflows, with $2.527 billion flowing through two channels, including $1.88 billion in stablecoins and $647 million combined in BTC and ETH ETFs.
ETF channel fund inflows have been declining over the past 4 weeks, which is worth noting.
Spot lending funds are in an expansion phase. The futures market is in the second expansion stage of this market trend.
Selling Pressure and Sales
After returning to $100,000, some buy-the-dips funds took profit. With liquidity restoration, some long-term holders made small sales. Overall, the stage of "long-term holders reducing while short-term buyers increase" has not fully opened, with long-term buyers who have experienced more pressure awaiting higher prices.
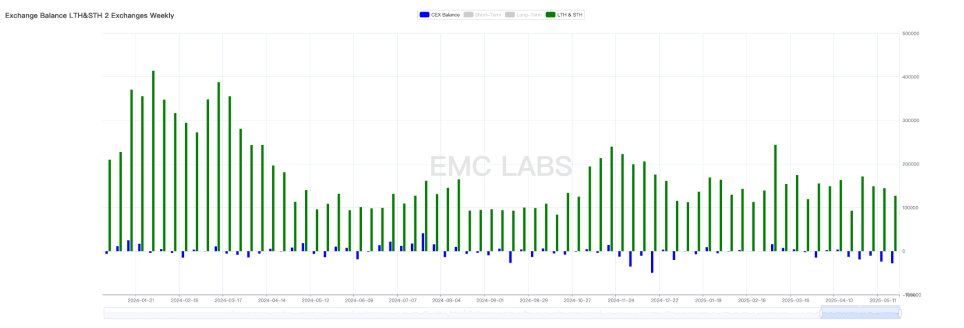
Centralized cryptocurrency exchange BTC inflow and outflow statistics
In terms of reduction scale, 127,226 BTC flowed into exchanges this week, declining for four consecutive weeks, while 27,965 BTC flowed out, the highest this year. Reduced selling scale and increased purchasing scale often indicate potential rapid price increases when external conditions are met.
Cycle Indicators
According to eMerge Engine, the EMC BTC Cycle Metrics indicator is 0.875, in an upward phase.

EMC Labs was created in April 2023 by crypto asset investors and data scientists. Focusing on blockchain industry research and crypto secondary market investment, with industrial foresight, insights, and data mining as core competencies, committed to participating in the booming blockchain industry through research and investment, and promoting blockchain and crypto assets' benefits to humanity.
For more information, please visit:https://www.emc.fund


