

Ethereum (ETH) has risen by more than 58% over the past 30 days, with approximately 40% of that increase occurring in the last 10 days. Despite this sharp rise, several key indicators have begun to send warning signals.
BBTrend has turned negative, whale accumulation is decreasing, and short-term EMA momentum is stagnating. These signals suggest that Ethereum may need new buying pressure to maintain its upward trend or could face a potential reversal.
Ethereum BBTrend Declines After a Month of Gains
Ethereum's BBTrend has entered the negative zone at -0.02 after maintaining a positive trend for about 7 consecutive days.
This change signals the end of the rising phase after reaching a strong peak of 28.39 on May 12th.
Questions are arising about whether the asset is entering a correction after rising 58.5% last month or showing early signs of decline.
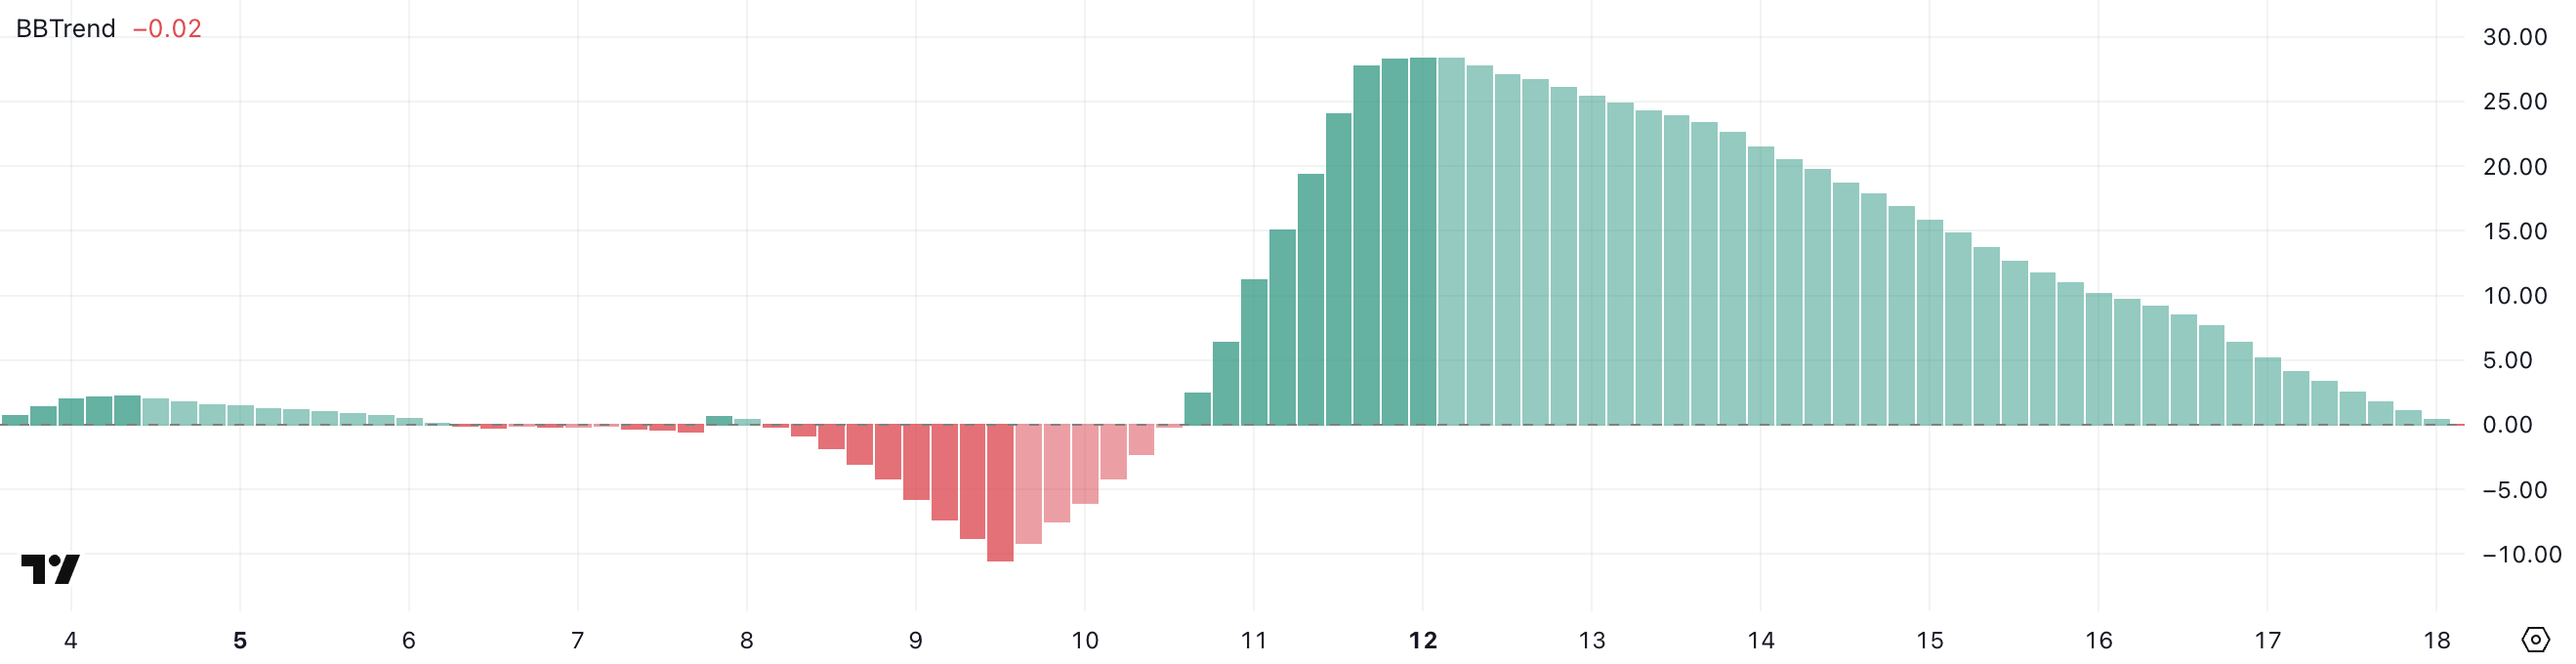
BBTrend, or Bollinger Bands Trend, measures price momentum relative to volatility by assessing how far the price deviates from the average within the Bollinger Bands.
When the BBTrend value is positive, it typically indicates upward momentum, while a negative value suggests the market is entering a bearish phase or losing strength.
ETH's BBTrend dropping slightly below 0 may indicate weakening buying pressure after the recent rally. If this trend continues to decline, Ethereum's price could stagnate or retreat.
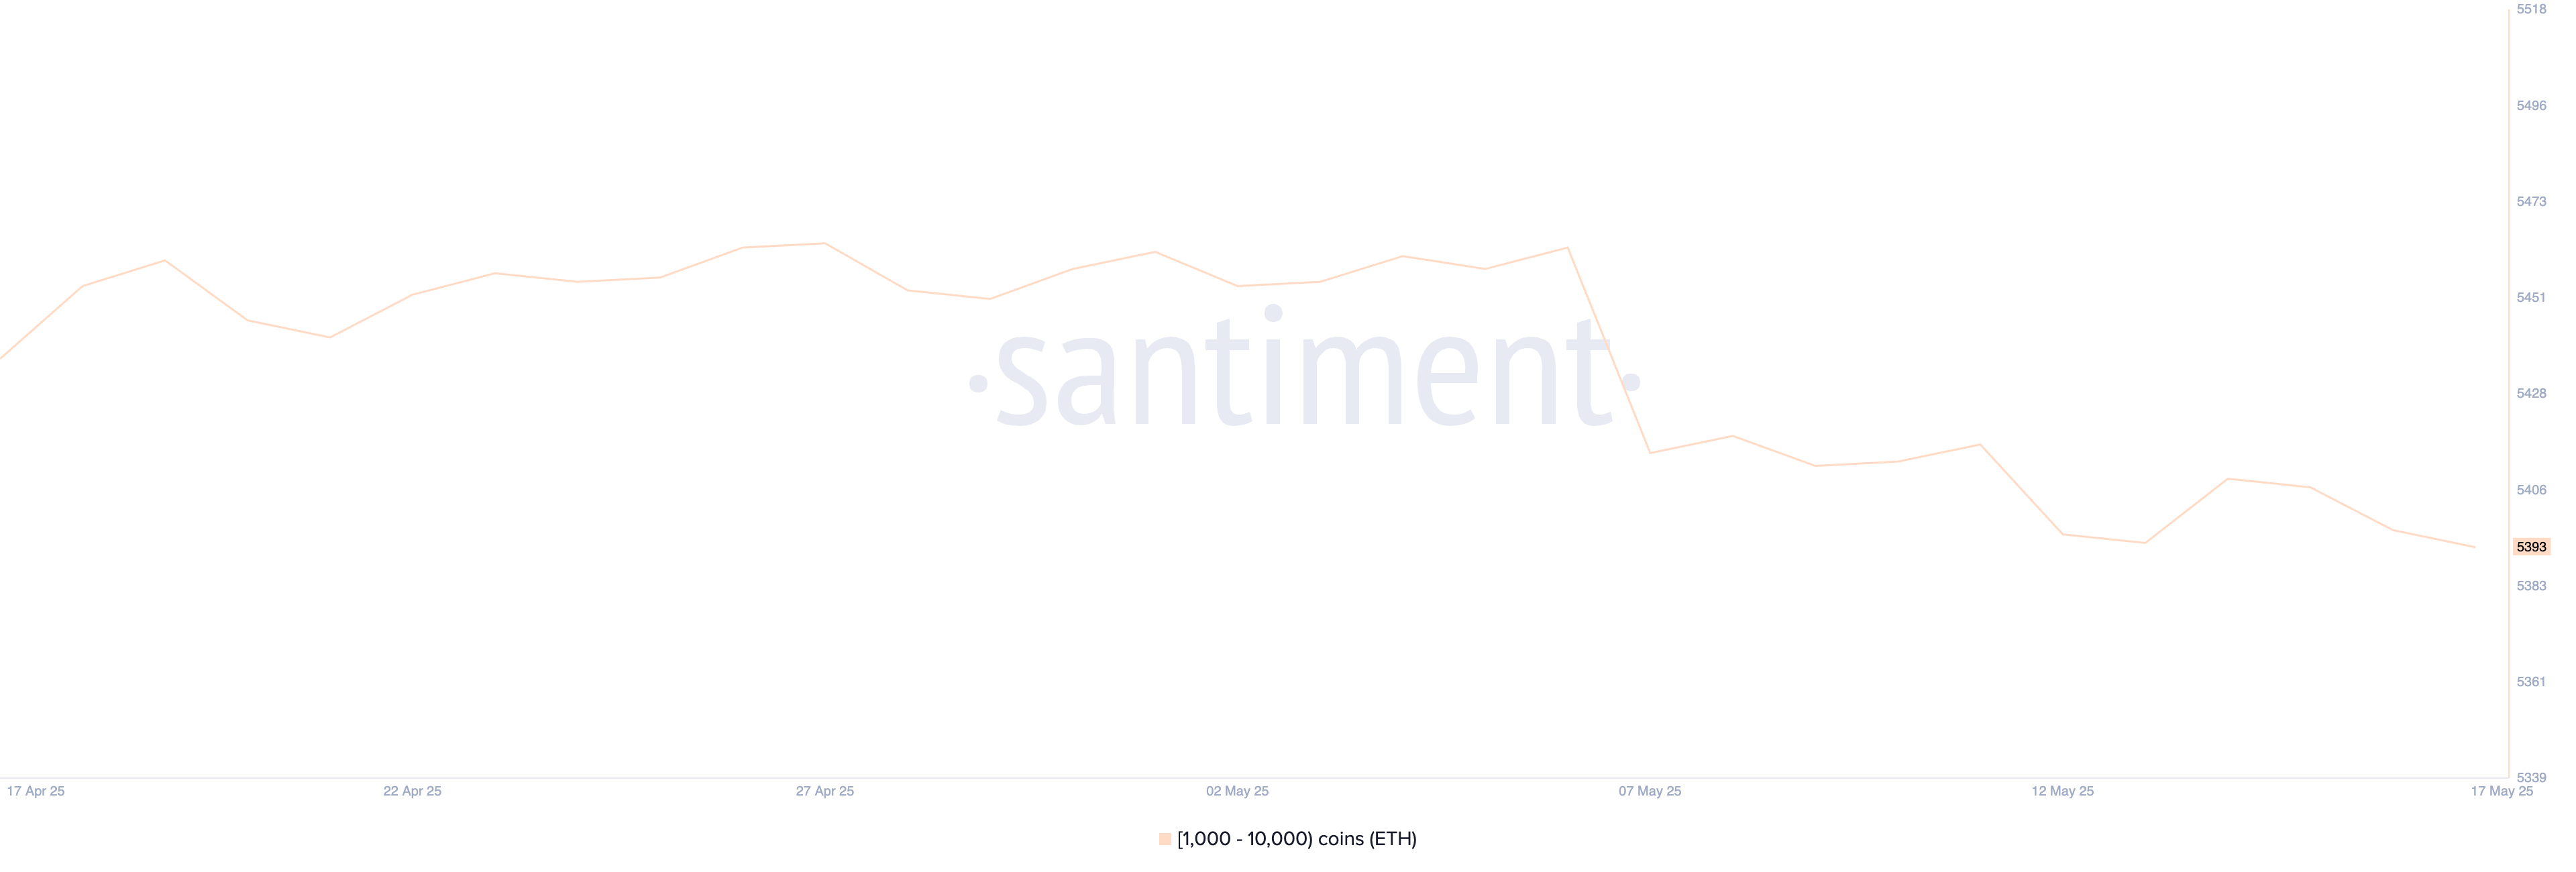
Ethereum Whale Count Drops Below Major Level for First Time Since April 9th
Ethereum whale activity shows signs of decrease after weeks of stability. Addresses holding 1,000 to 10,000 ETH are classified as whales, maintaining over 5,440 since mid-April and reaching 5,463 on May 8th.
However, this number has been gradually decreasing over the past 10 days, continuing to decline despite slight fluctuations.
Currently at 5,393, it has fallen below 5,400 for the first time since April 9th, which is an important psychological and historical support level for large holders.
Tracking Ethereum whales is crucial as these addresses often move the market due to their large holdings. An increase in whale count typically indicates accumulation, reflecting confidence and long-term positioning.
Conversely, a decrease could suggest distribution, profit-taking, or shifting attention among major players.
The recent decline may imply reduced confidence among large investors after ETH's strong rally, potentially leading to increased price momentum volatility or a cooling period.
This occurs at a time when some analysts suggest ETH could overtake BTC, while others question whether ETH remains a good investment in 2025.
ETH Struggles Near $2,700… Can It Reclaim $3,000?
Ethereum's EMA (Exponential Moving Average) lines still show strength, with short-term EMA positioned above long-term EMA.
However, momentum is slowing, with short-term lines flattening and their gap narrowing. This pattern often indicates a potential trend change, especially if buyers fail to regain control.
The overall structure remains positive, but loss of upward momentum introduces short-term uncertainty.
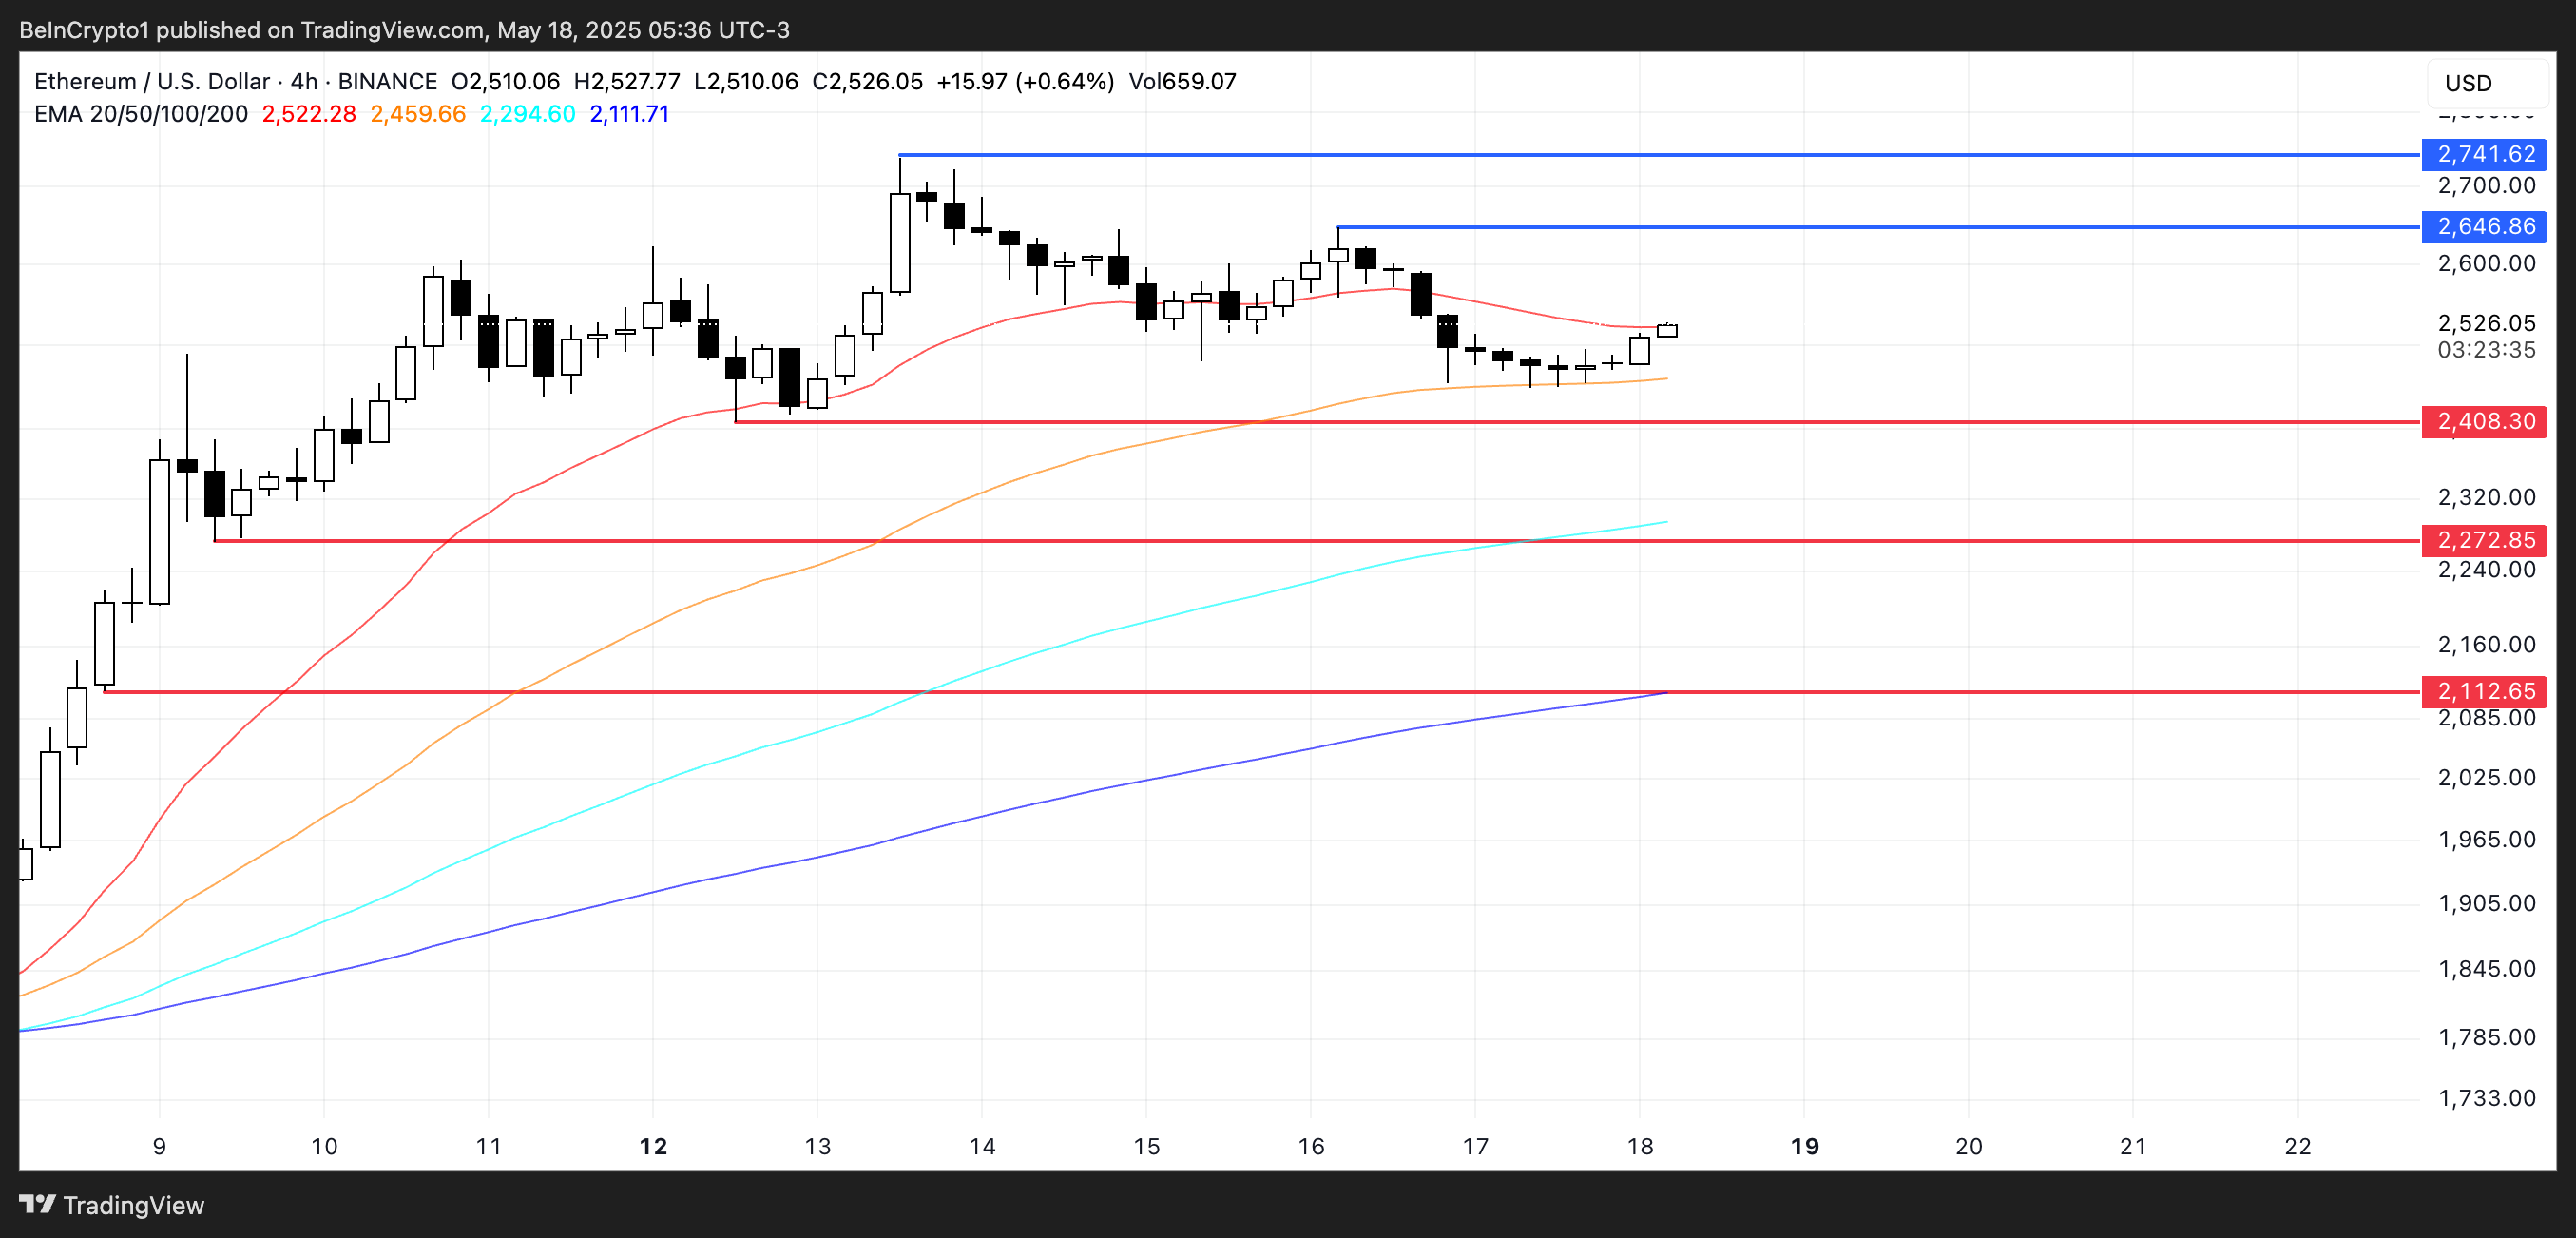
ETH price has struggled to break through key resistance levels at $2,741 and $2,646 in recent days.
Without new buying pressure, the asset may fail to recover the psychological $3,000 level, which it hasn't touched since February 1st.
If selling pressure increases, Ethereum could revisit the $2,408 support level. A breakdown there could trigger additional losses, with $2,272 and $2,112 serving as the next critical support zones.

