

On Monday, the United States and China established a 90-day tariff suspension agreement. This announcement raised new optimism in global financial markets, and the cryptocurrency market also benefited from this change in atmosphere.
However, this led to only $5 million in net inflows to the Bitcoin ETF market, which is the lowest daily total inflow since April 14.
Profit-taking, Bitcoin ETF Demand Slows Down
On Monday, as trading activity surged, BTC reached an intraday high of $105,819. However, with profit-taking soon following, the major coin lost some of its gains and closed at $102,729.
The decline below the psychologically important $105,000 level weakened institutional enthusiasm. This hindered massive capital inflows into spot Bitcoin ETFs. As a result, net inflows into the ETF market were just $5.2 million on Monday, which is the lowest daily total inflow since April 14.
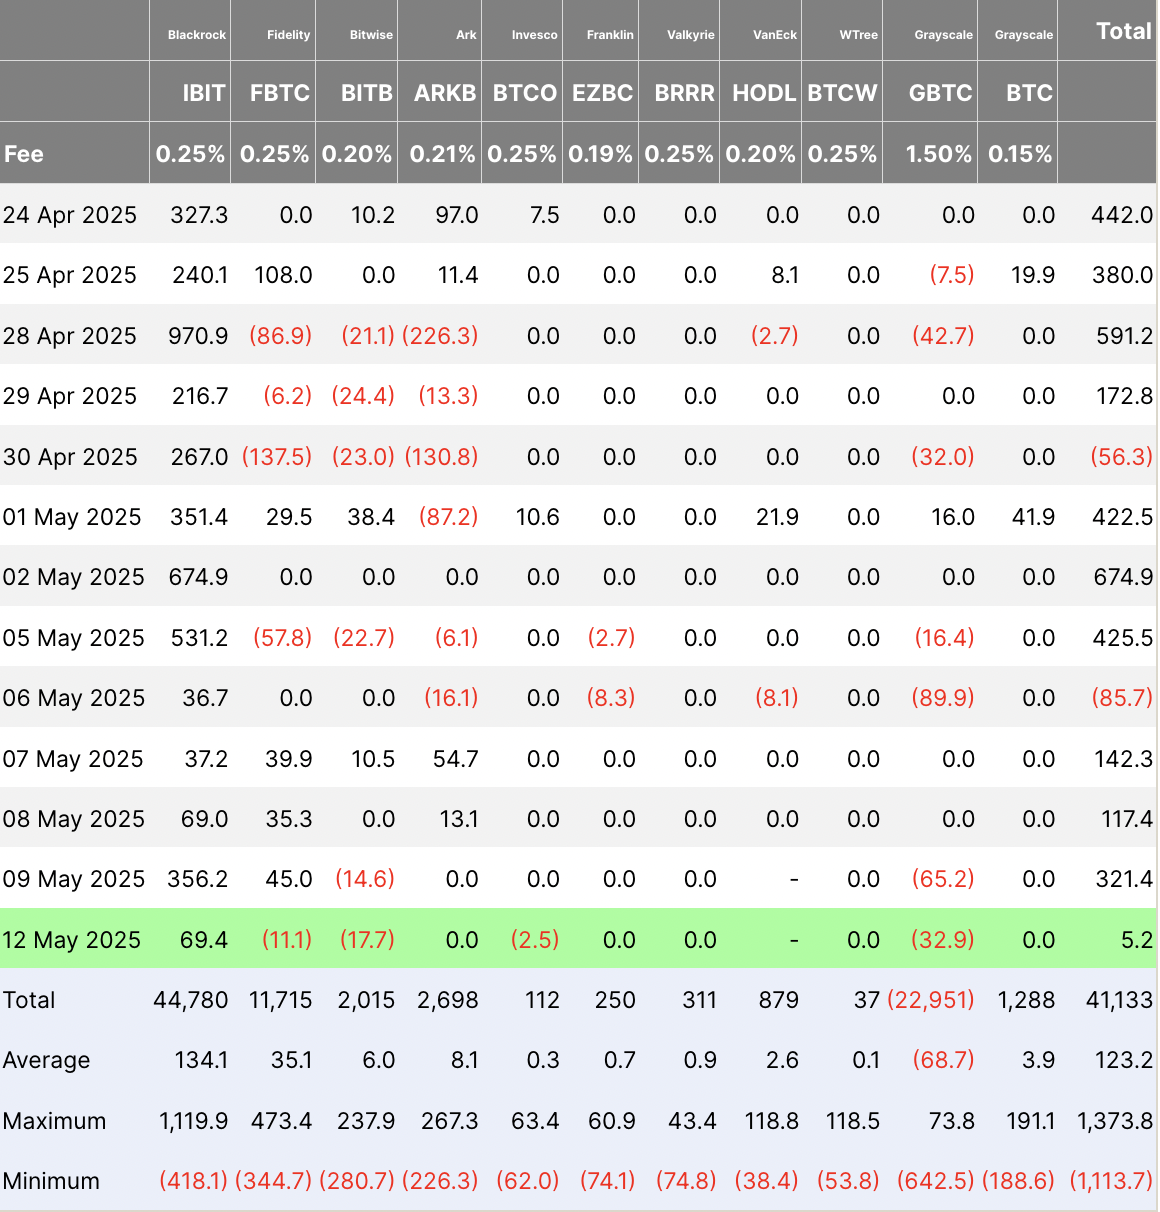
BlackRock's iShares Bitcoin Trust (IBIT) recorded the highest daily inflow among all issuers. On Monday, the fund's net inflow was $69.41 million, with a total historical net inflow of $4.478 billion.
Meanwhile, Grayscale's Bitcoin Trust ETF (GBTC) recorded the highest net outflow among all issuers on Monday, with $32.92 million leaving the fund. GBTC's total historical net inflow is currently $2.295 billion.
This adjustment suggests that institutional investors are waiting for BTC to recover or stabilize at major resistance levels.
Bitcoin Adjusts After Surge to $105,000
At the time of publication, BTC is trading at $102,367, down 2% in the past 24 hours. On Monday, the coin briefly surged to a 3-month high of $105,819 following the US-China trade agreement. However, due to traders' profit-taking, an adjustment occurred, and BTC closed below the psychological $105,000 price mark.
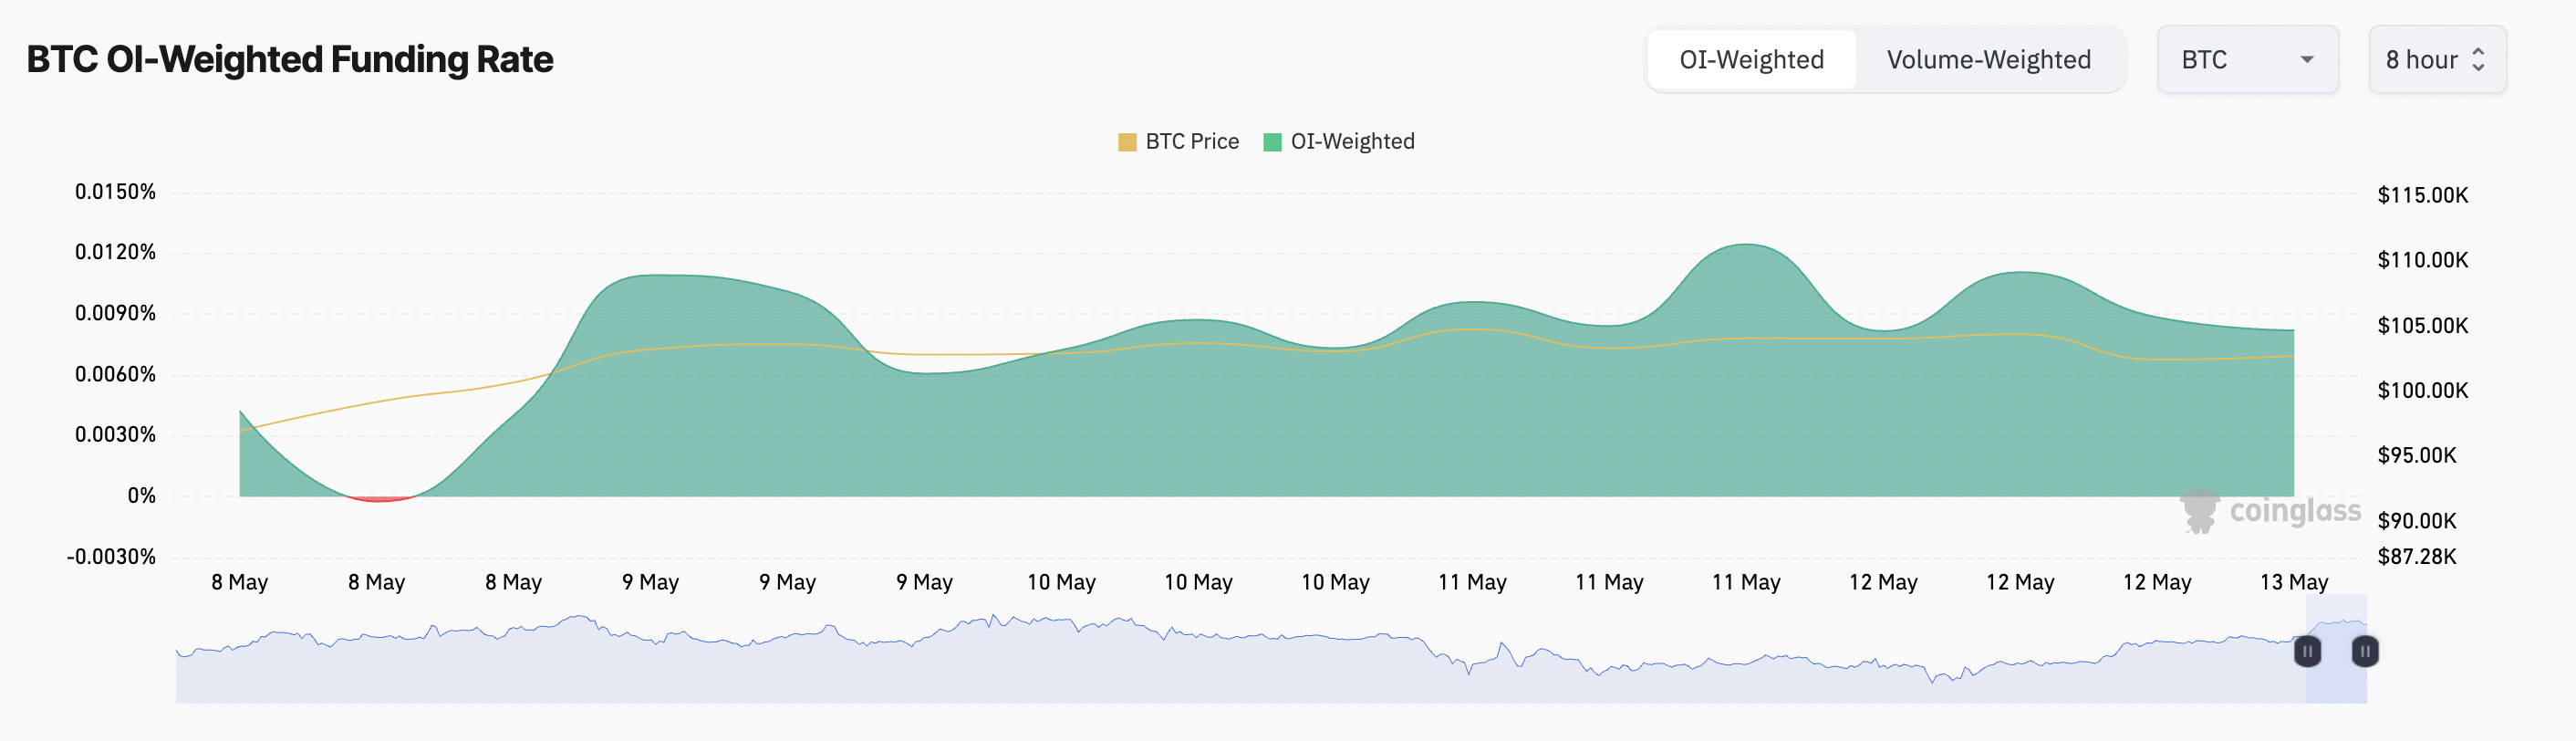
The decline suggests short-term selling pressure, but market sentiment remains optimistic. This is evident from BTC's funding rate remaining positive, suggesting that traders expect a continued rally despite a temporary retreat.
Moreover, the BTC liquidation heatmap shows significant liquidity concentration around the $105,337 level.
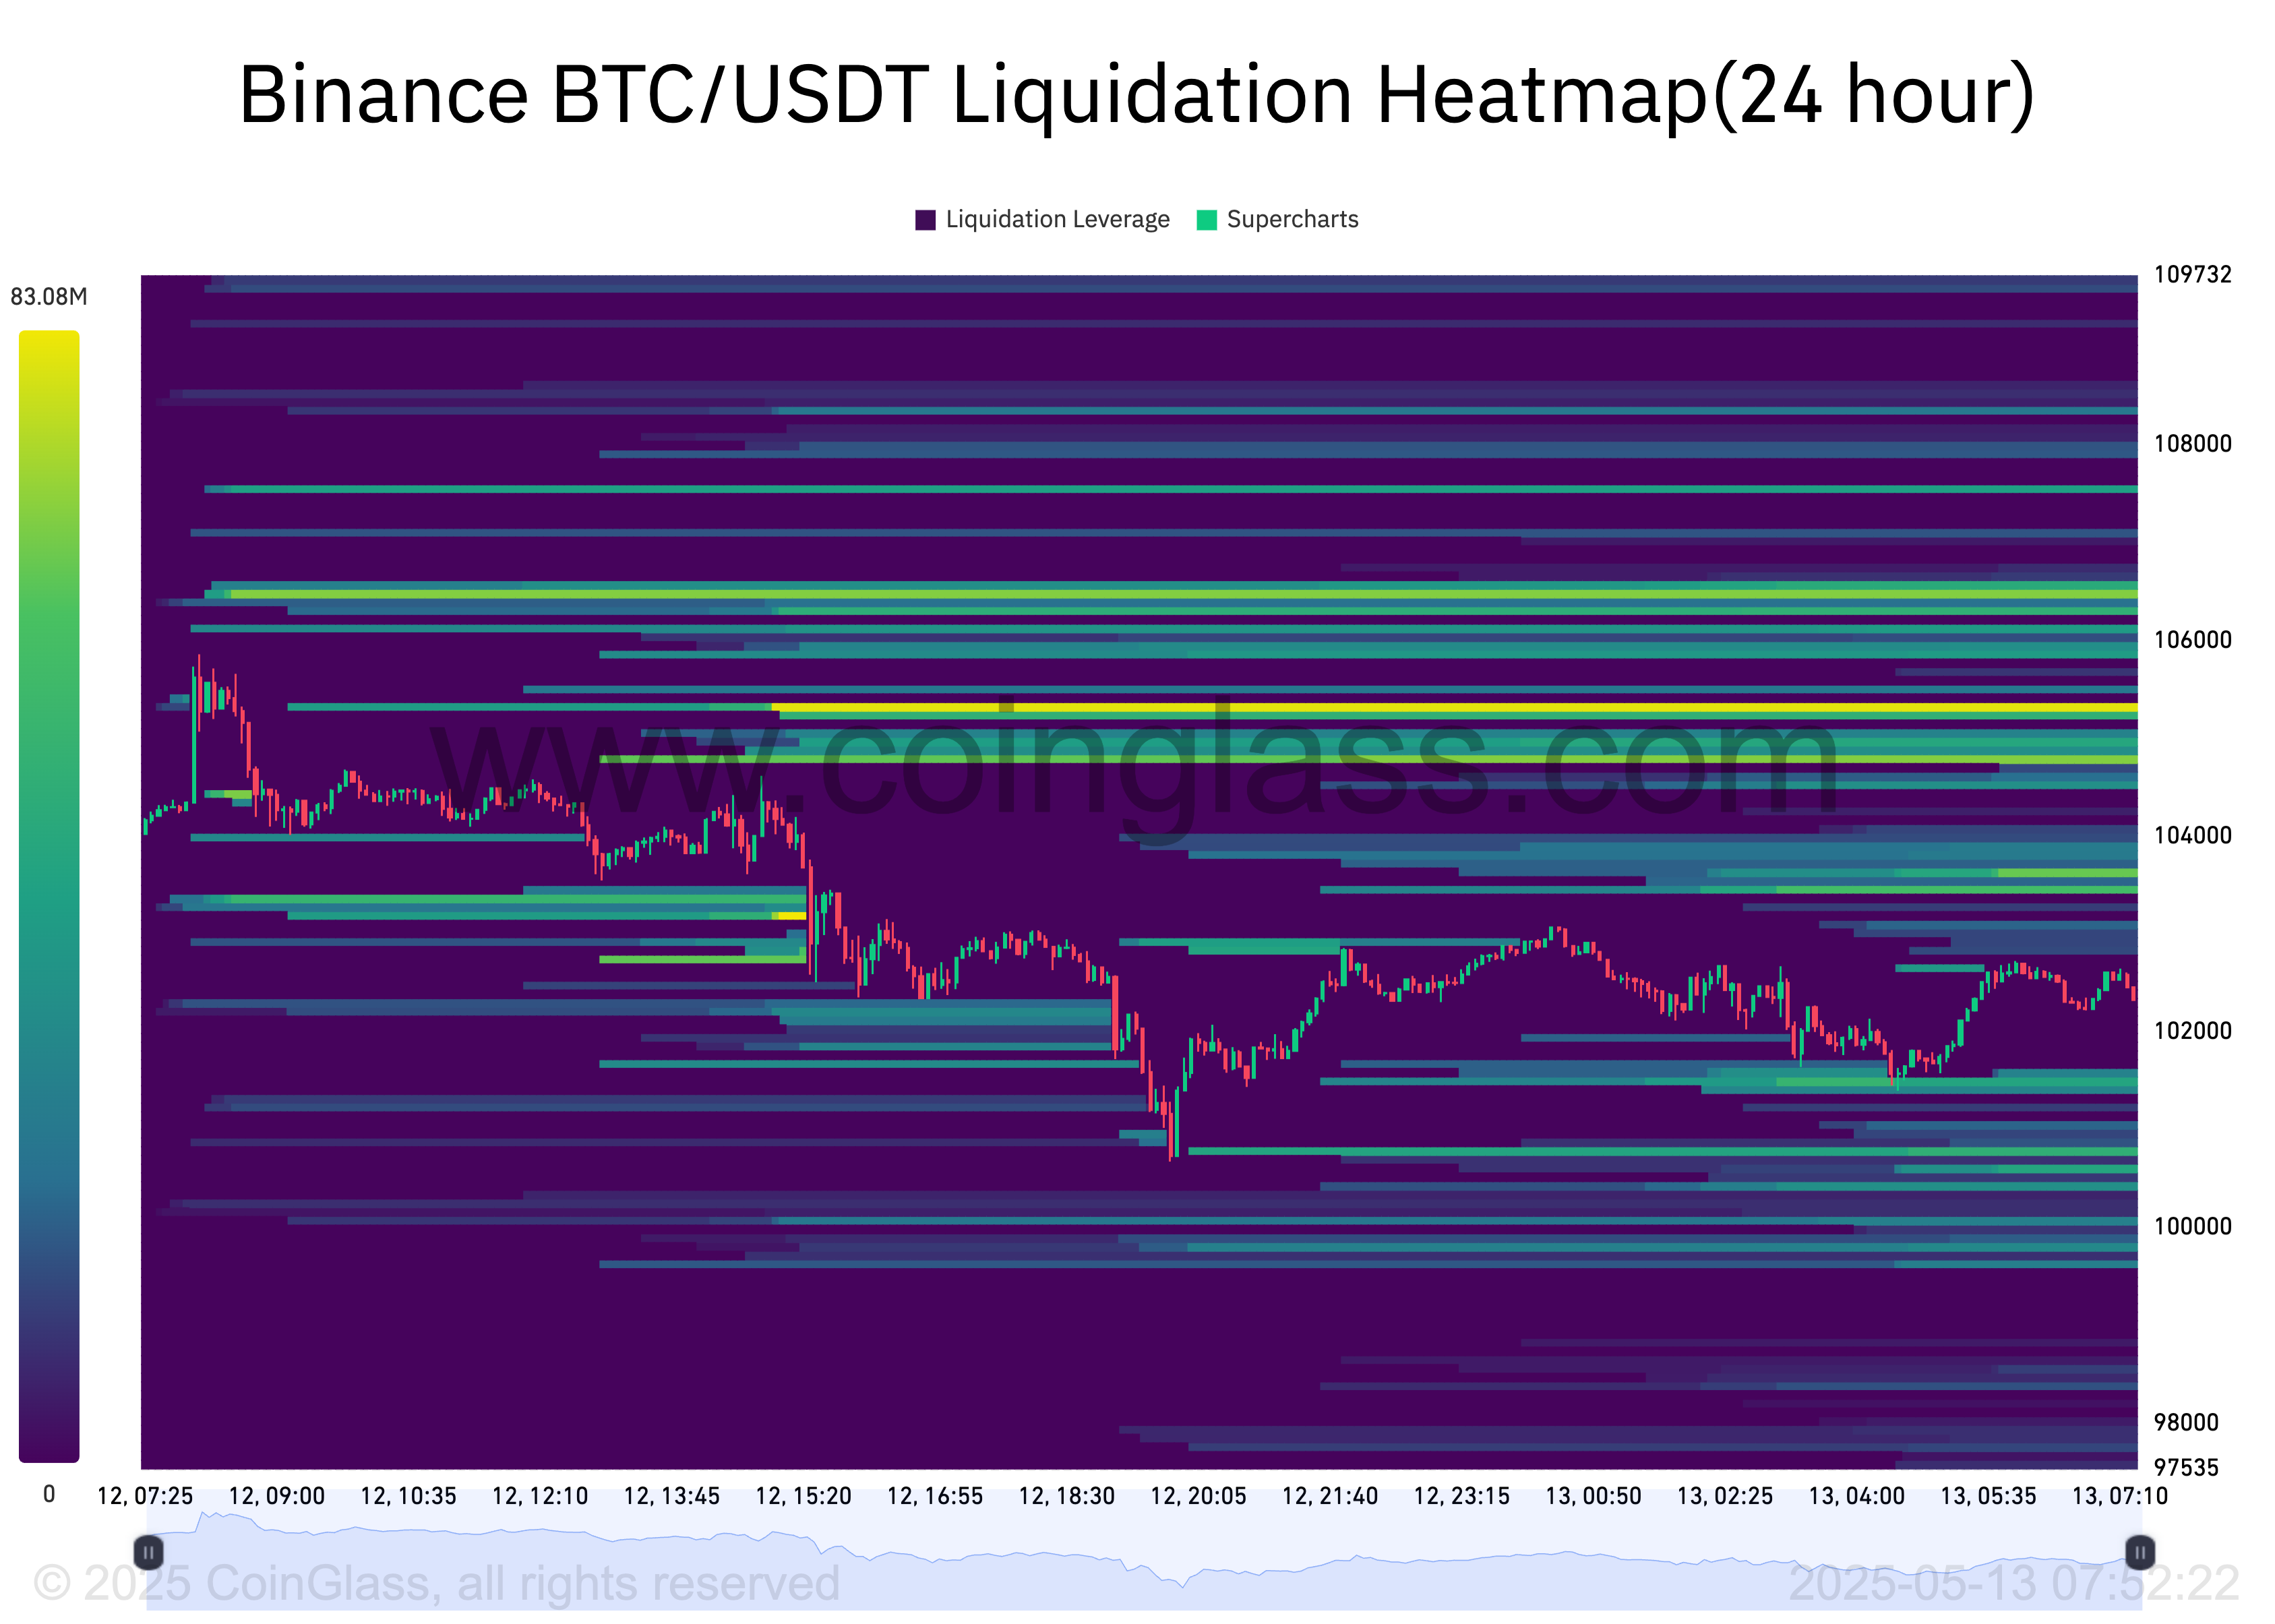
The heatmap highlights potential price zones where large liquidations could occur, providing traders with insights into high-liquidity areas.
These zones are marked in yellow, and assuming BTC resumes its upward trend and maintains its current bullish structure, it could break through the $105,000 level. In such a scenario, traders holding short positions might face a short squeeze.


