

XRP has risen by 4% in the past 24 hours. This is due to growing investor optimism as the possibility of a US XRP spot ETF approval increases. Along with this, technical signals are also improving, with the RSI recovering to the neutral zone and price movements maintained just above the Ichimoku Cloud.
XRP is still within a range, but the rising EMA structure and support stability suggest that the market is cautiously optimistic. Breaking through resistance could be a critical period that, combined with ETF-related discussions, could drive further increases.
XRP RSI Rebounds to Neutral Zone… Momentum Shift?
XRP's Relative Strength Index (RSI) has significantly rebounded from 36.51 yesterday to 50.40 today. This follows the overbought peak of 70.95 on April 28th.
This change reflects a easing of selling pressure after a sharp decline and places XRP in a more neutral technical area.
While the RSI has not fully recovered to the upward zone, crossing above 50 could indicate a potential momentum change, especially if it continues to rise in subsequent sessions.
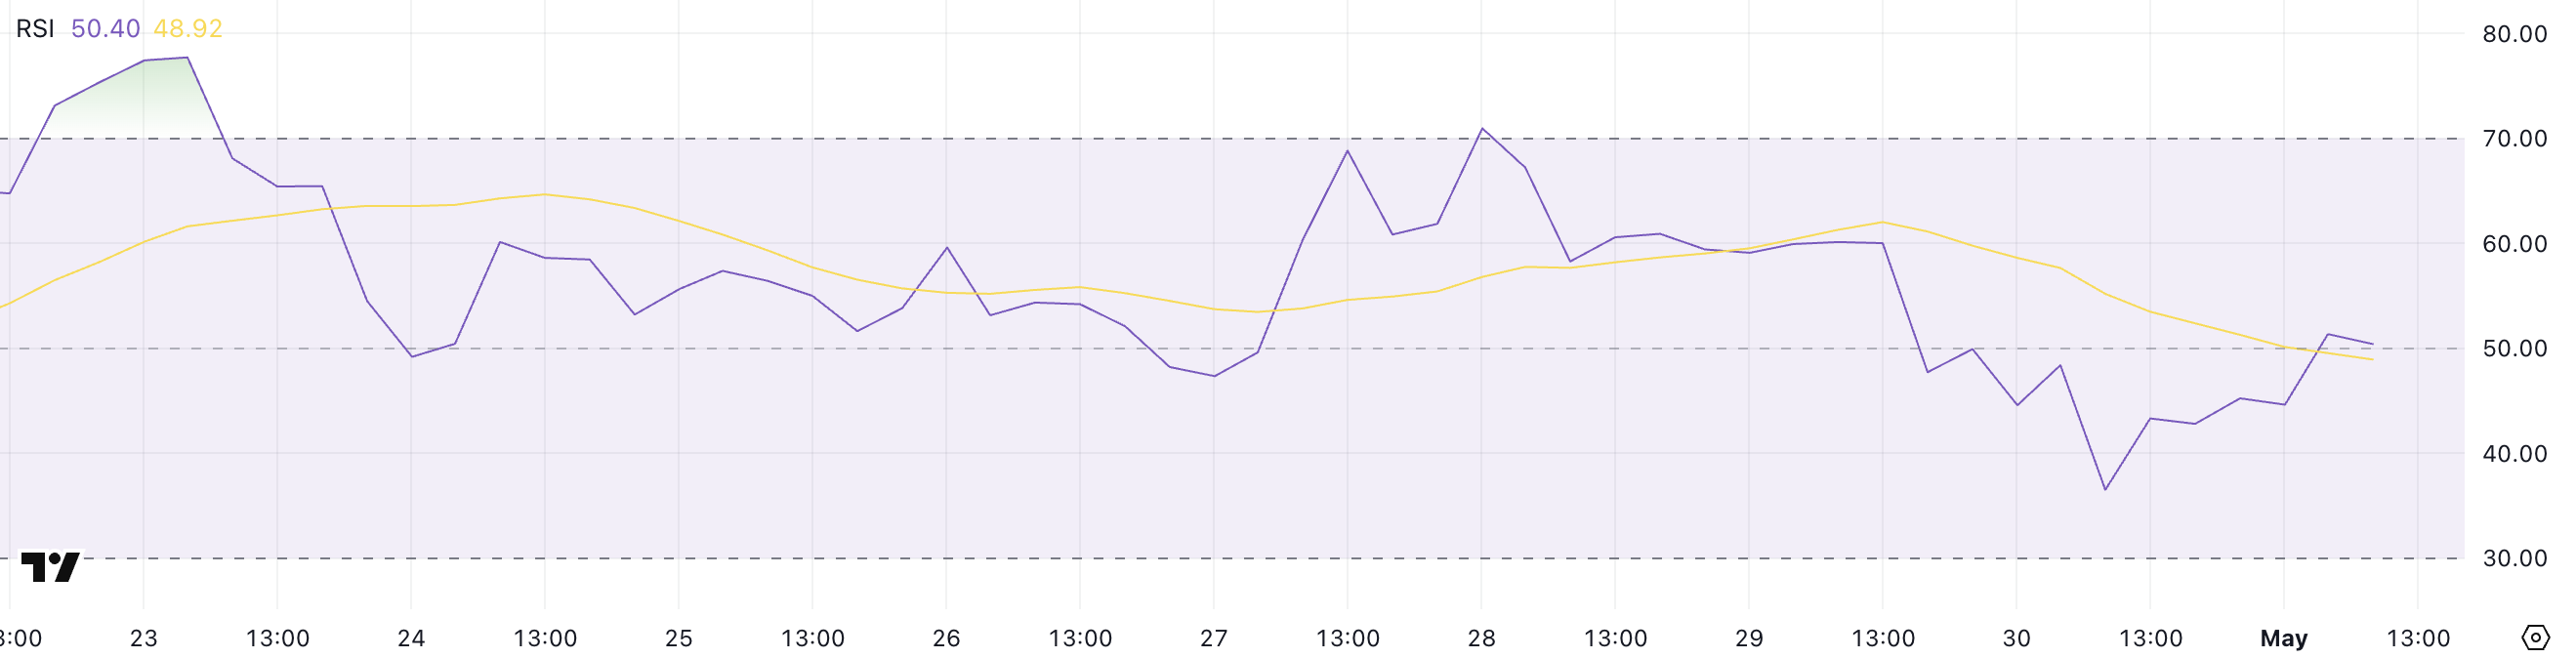
The RSI is a momentum indicator that measures the speed and change of price movements on a scale from 0 to 100. Levels above 70 indicate an overbought asset that may need correction, while below 30 suggests an oversold condition with potential for a rebound.
XRP's current RSI at 50.40 suggests the asset is neither overheated nor undervalued.
However, maintaining or rising from this level could support short-term upward potential, especially with strong trading volume or breaking nearby resistance.
XRP Seeking Direction
The Ichimoku Cloud chart shows XRP trading just above the cloud, an area that often serves as dynamic support in an upward setting.
The current position suggests weak upward momentum. However, the forward cloud has changed from green to red, indicating potential resistance and a weakened trend outlook.
The conversion line (blue line) and base line (red line) are close and mostly flat, reflecting short-term uncertainty even with a slight price increase.
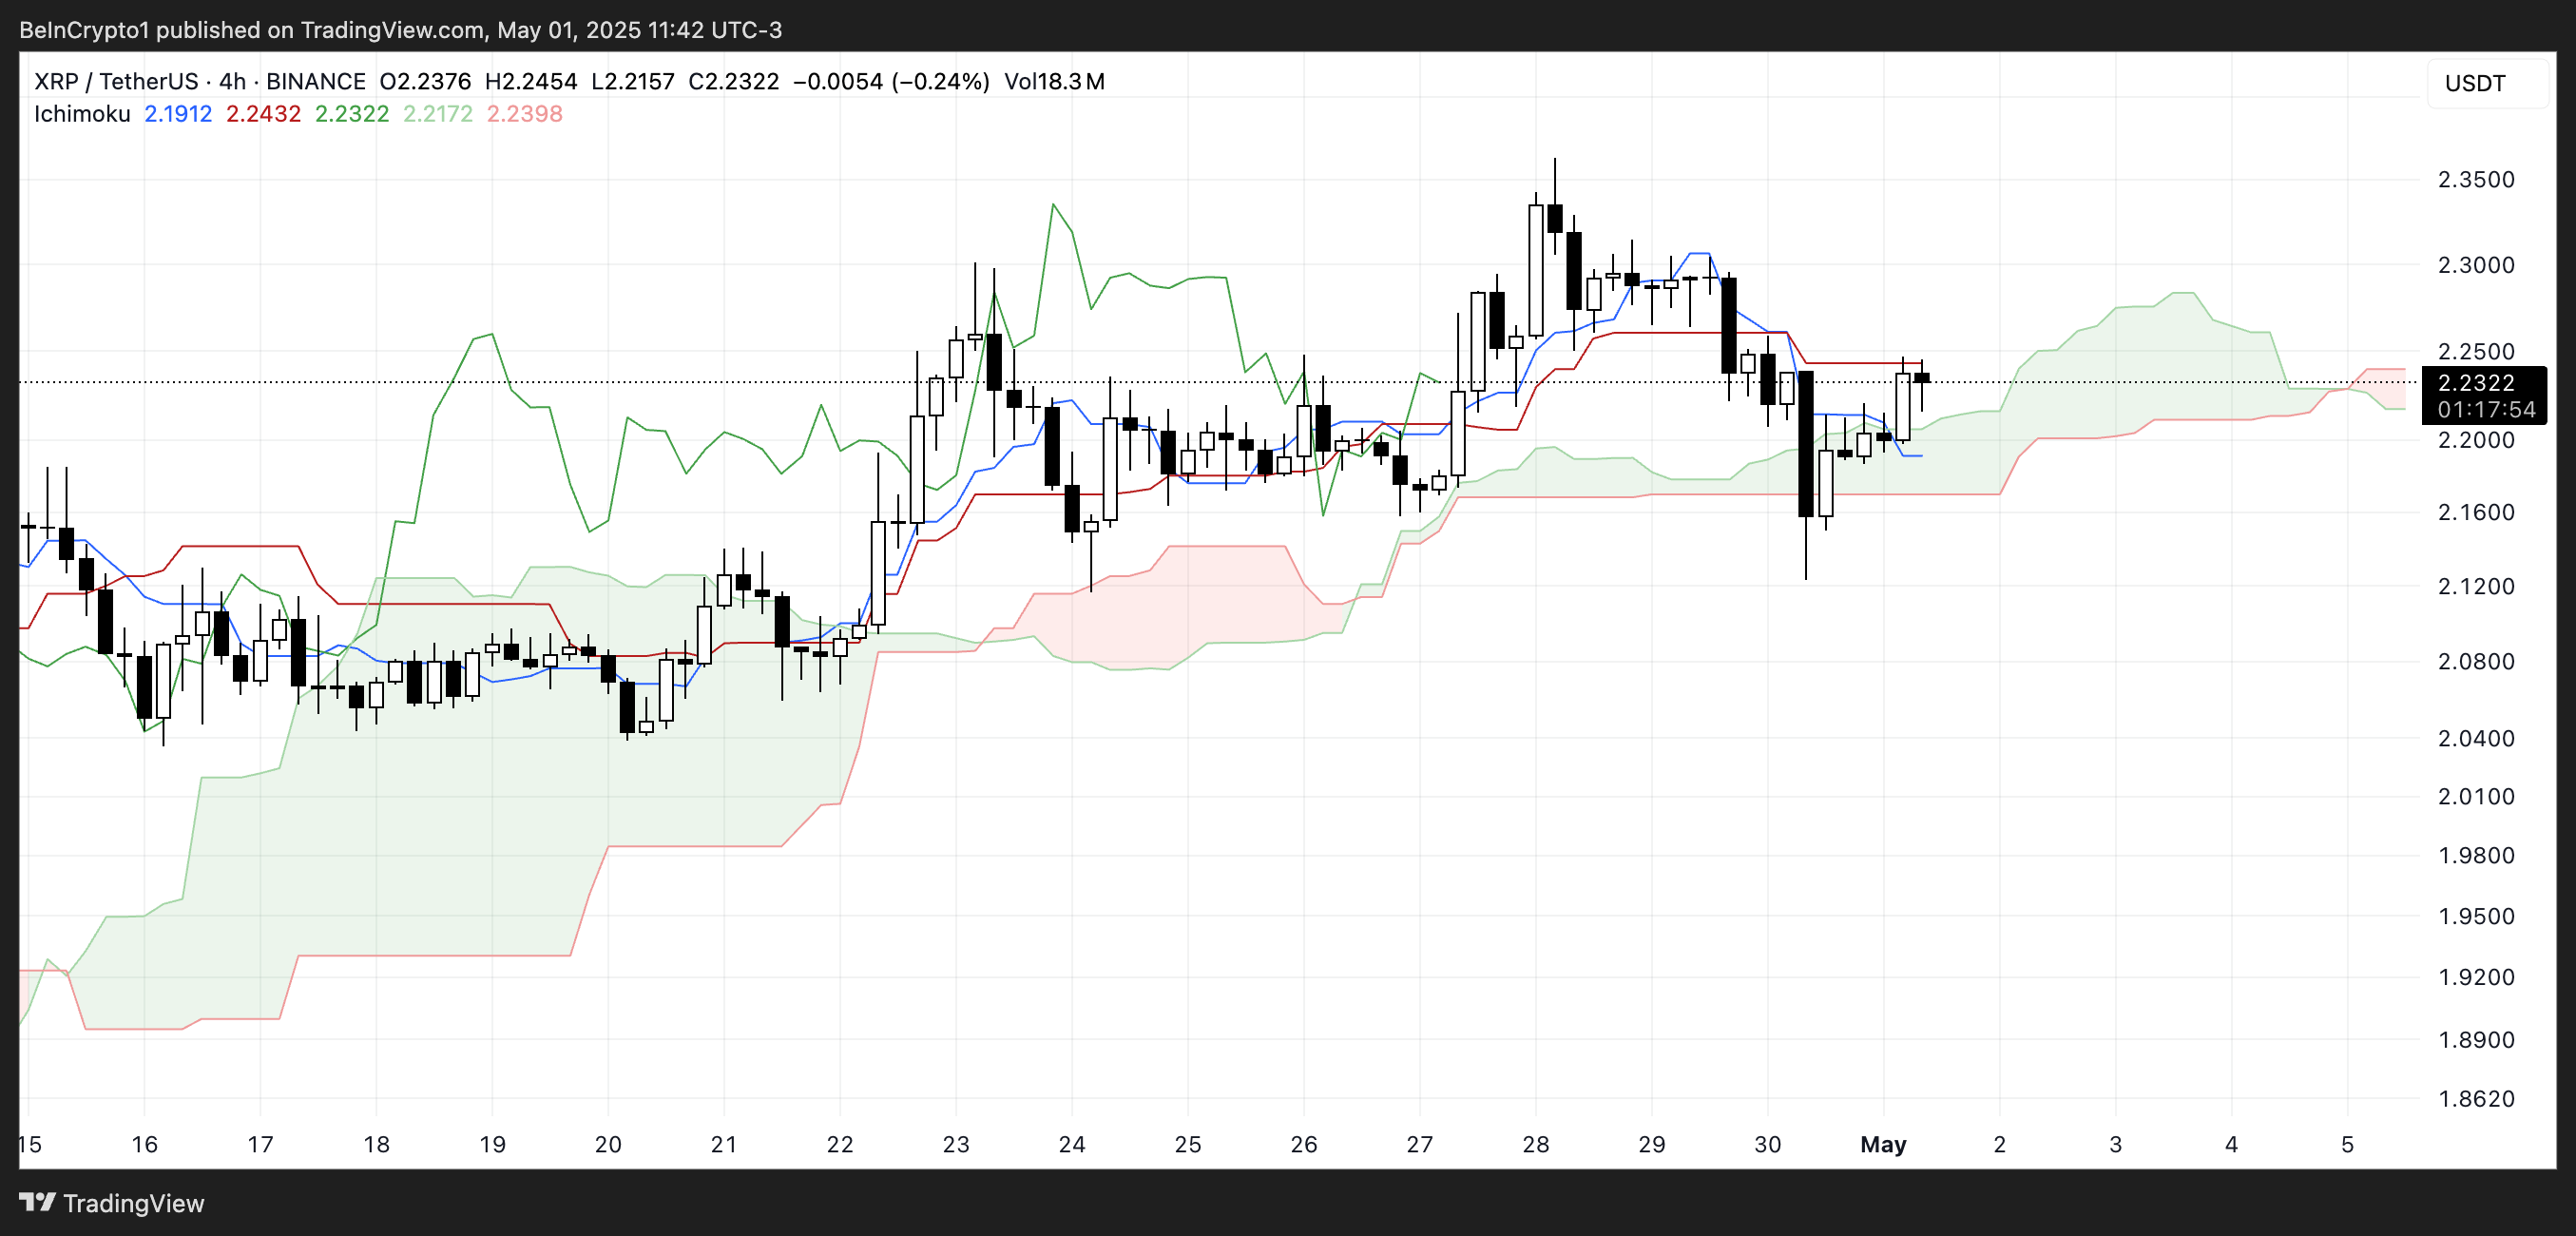
The lagging span (green line) remains near past price movements, not providing confirmation of strong continued upward movement.
The transition to the red cloud ahead requires caution. It may represent an upcoming battle between an upward trend trying to maintain support and a downward trend seeking reversal.
A decisive move out of or back into the cloud is likely to determine XRP's next trend direction.
XRP Maintains Strong EMA Structure… Facing Critical Price Levels
XRP's Exponential Moving Average (EMA) remains in an upward trend. The short-term line is above the long-term line, indicating upward momentum. This occurs as the possibility of an XRP spot ETF approval has risen to 85% in 2025.
However, price movement is trapped between the $2.30 resistance and $2.15 support, a narrow range that could be controlled either way.
If the $2.15 support is retested and breaks, XRP could decline to $2.03, and potentially $1.90, which would pressure the upward structure.
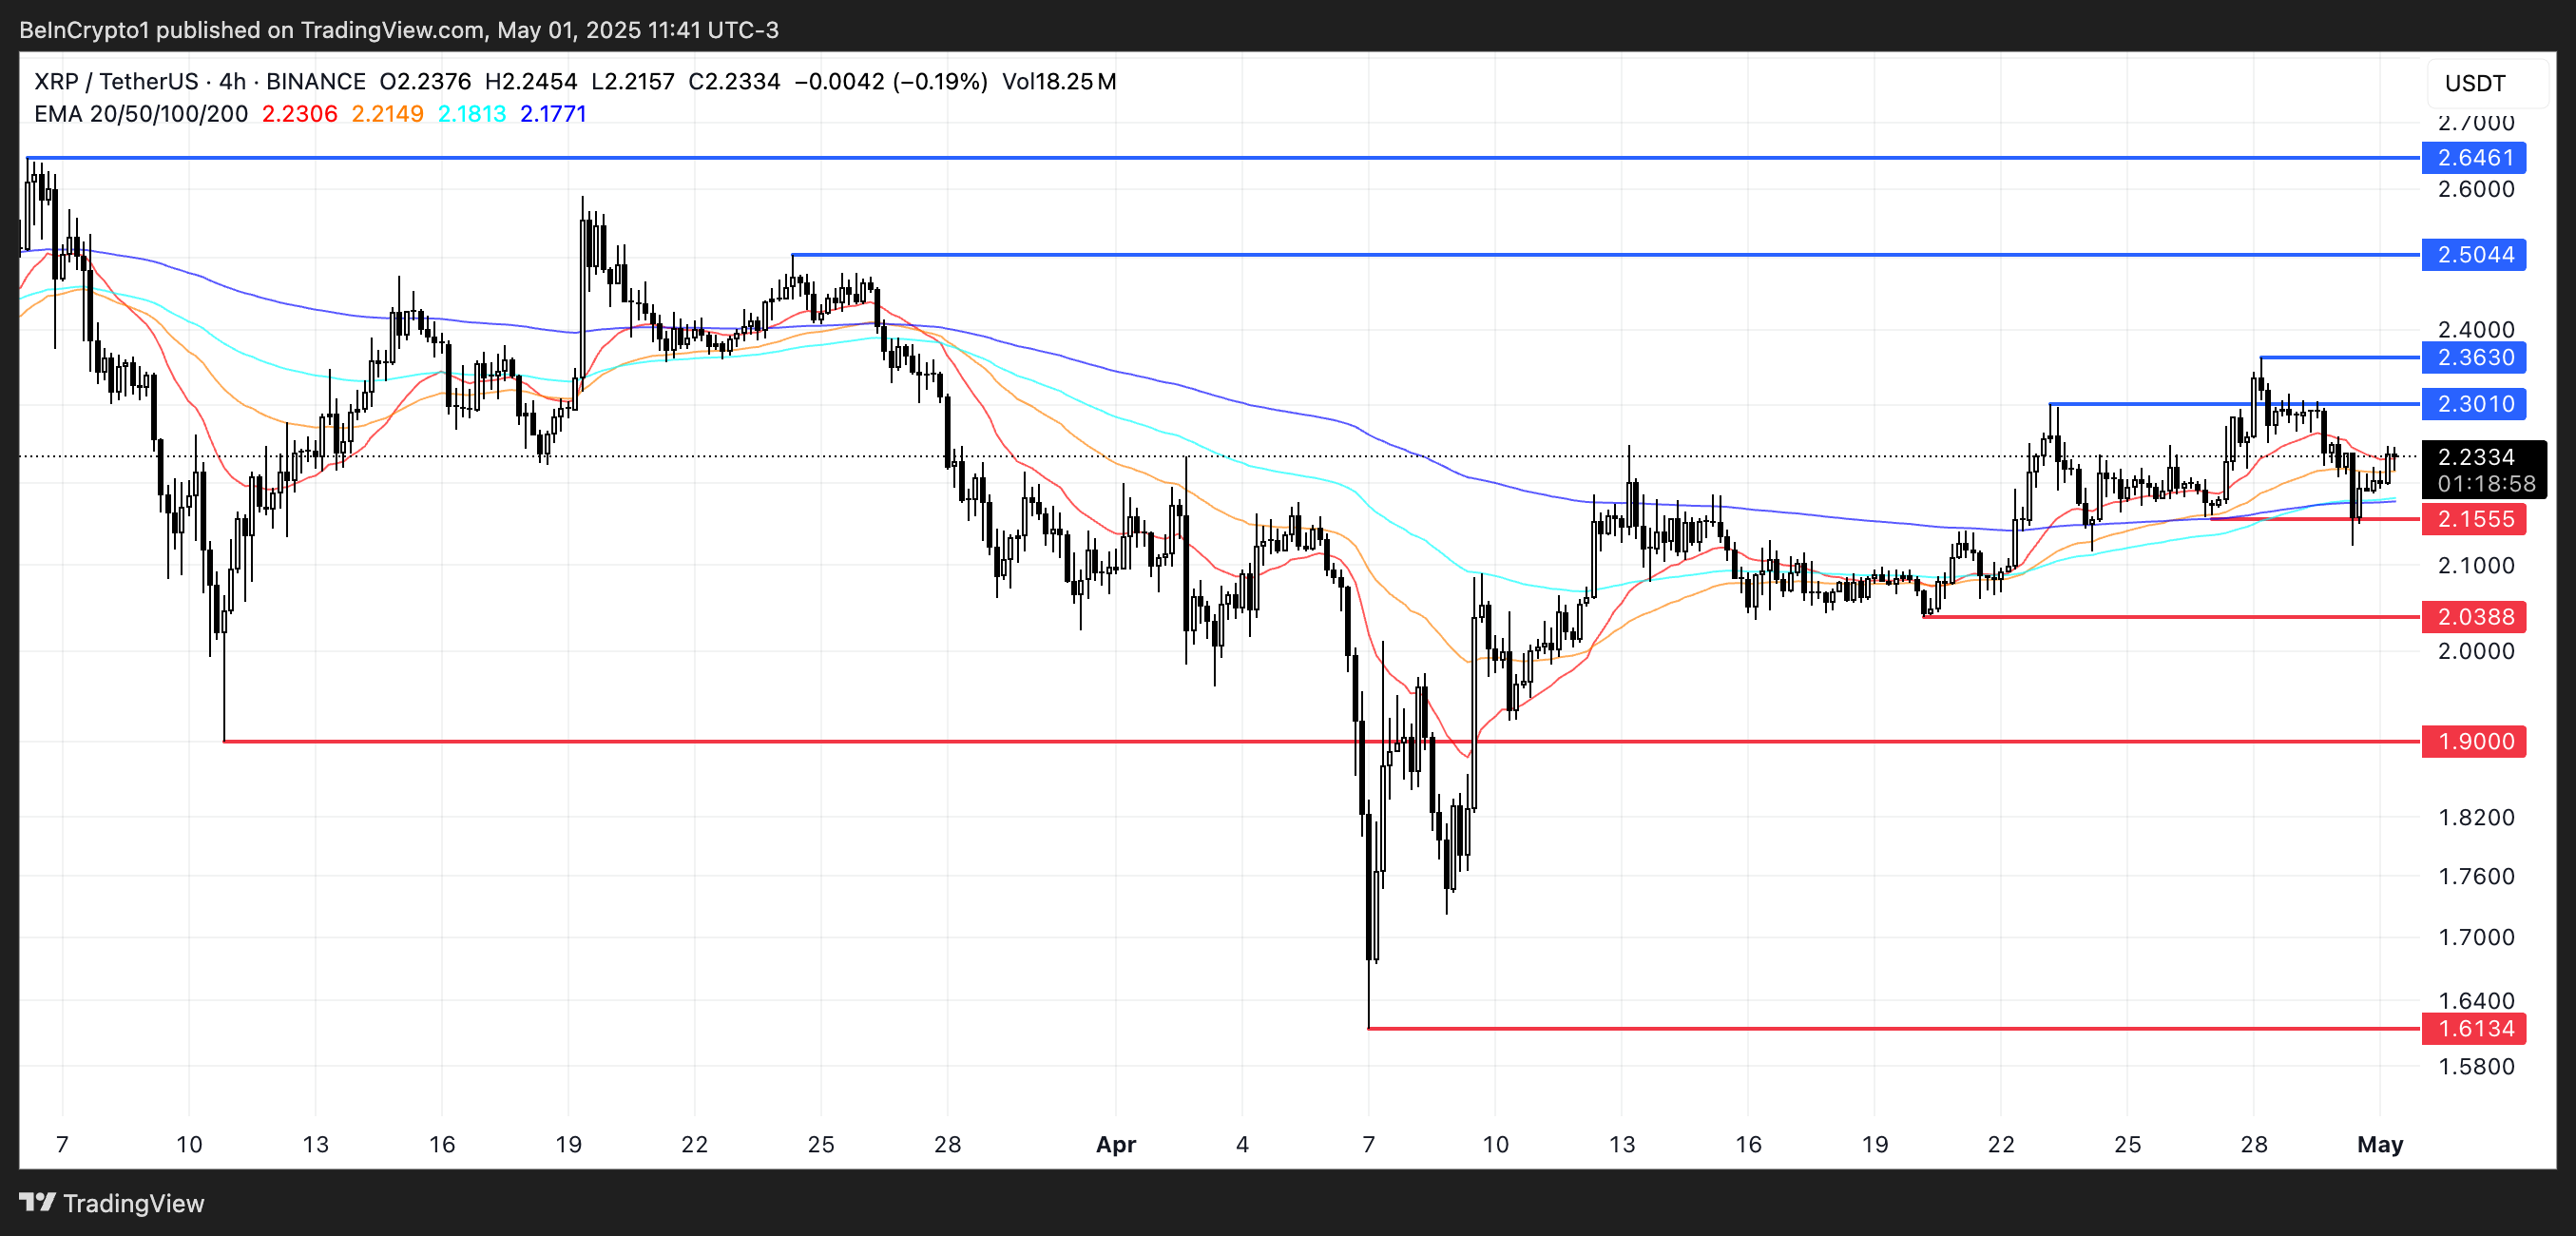
Conversely, successfully breaking the $2.30 resistance could trigger a new increase, especially if it surpasses $2.36.
In that case, XRP price would target $2.50 and potentially $2.64 as the next resistance zone.
As long as the EMA maintains its current structure, the upward trend retains technical advantage. However, a decisive move beyond the current range is needed to confirm the next directional trend.


