

Hedera (HBAR) rose by more than 8% on Friday, expanding its seven-day rally to 21.7%. This rally appeared alongside momentum signals, including BBTrend's sharp increase and RSI entering the overbought area.
The price is also approaching a major resistance zone and is supported by EMA alignment, suggesting the upward trend may continue.
Hedera's BBTrend Surge... What Does It Mean?
Hedera's BBTrend indicator has sharply risen to 6.83, a significant increase from 1.5 two days ago. This surge indicates a substantial increase in price movement's volatility and momentum.
BBTrend is a derivative of Bollinger Bands that measures the strength and direction of a trend. Values below 1 reflect a weak or flat market, while values above 3 indicate the emergence of a strong trend.
The sharp rise in BBTrend suggests the asset is moving out of a low-volatility phase into a more directional movement.
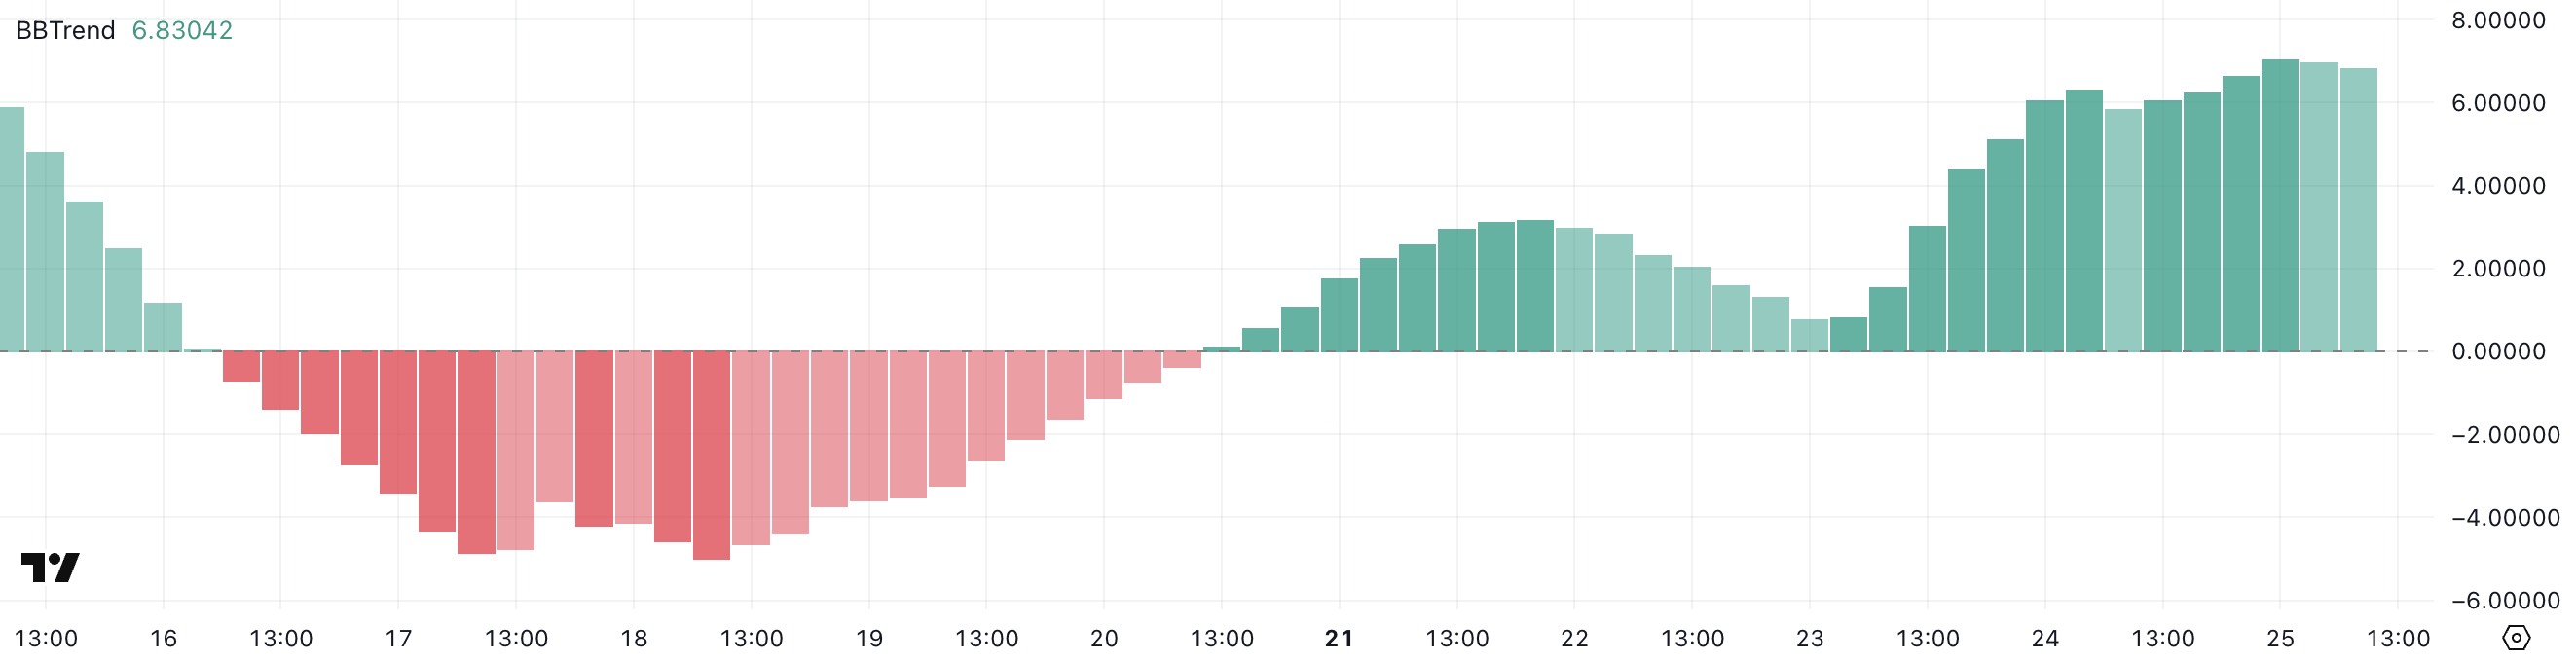
With BBTrend now reaching 6.83, Hedera may be in the early stages of a strong upward or downward breakout. These high levels suggest volatility is rapidly expanding and the price is beginning to decisively break out of its recent range.
While BBTrend does not indicate direction by itself, when combined with other bullish signals like rising prices or trading volume, it can confirm the start of a sustained upward trend.
Traders will carefully watch whether this momentum will continue or fade. A reversal at these high levels could also lead to a sharp decline.
Hedera's RSI Enters Overbought Zone... What's Next?
Hedera's RSI quickly rose from 52.49 to 73.93 two days ago, indicating a burst of strong buying momentum. The Relative Strength Index (RSI) is a momentum measurement indicator that tracks the speed and magnitude of price movements.
RSI ranges from 0 to 100, with values above 70 typically considered overbought and below 30 considered oversold.
When RSI exceeds 70, an asset may be temporarily overheated and could face a correction or consolidation.

With RSI deeply in the overbought zone, Hedera may be approaching a local peak, at least temporarily. A high RSI confirms strong upward momentum but can also indicate buyer fatigue.
If the price continues rising without stopping, the risk of decline increases.
However, sustained overbought conditions can occur during strong upward trends, so traders will carefully watch for signs of continued breakout strength or reversal.
Hedera, Breakout Imminent... Support Levels Are Crucial
Hedera's EMA lines show a classic momentum signal with short-term moving averages positioned above long-term moving averages.
HBAR price is also trading near the key resistance level of $0.20, which acted as a ceiling in recent sessions. If buyers can break through this zone, the next resistance levels are $0.227 and $0.258.
If the strong upward trend continues, HBAR could rise to $0.287, which would be its first break above $0.28 since February 1st.
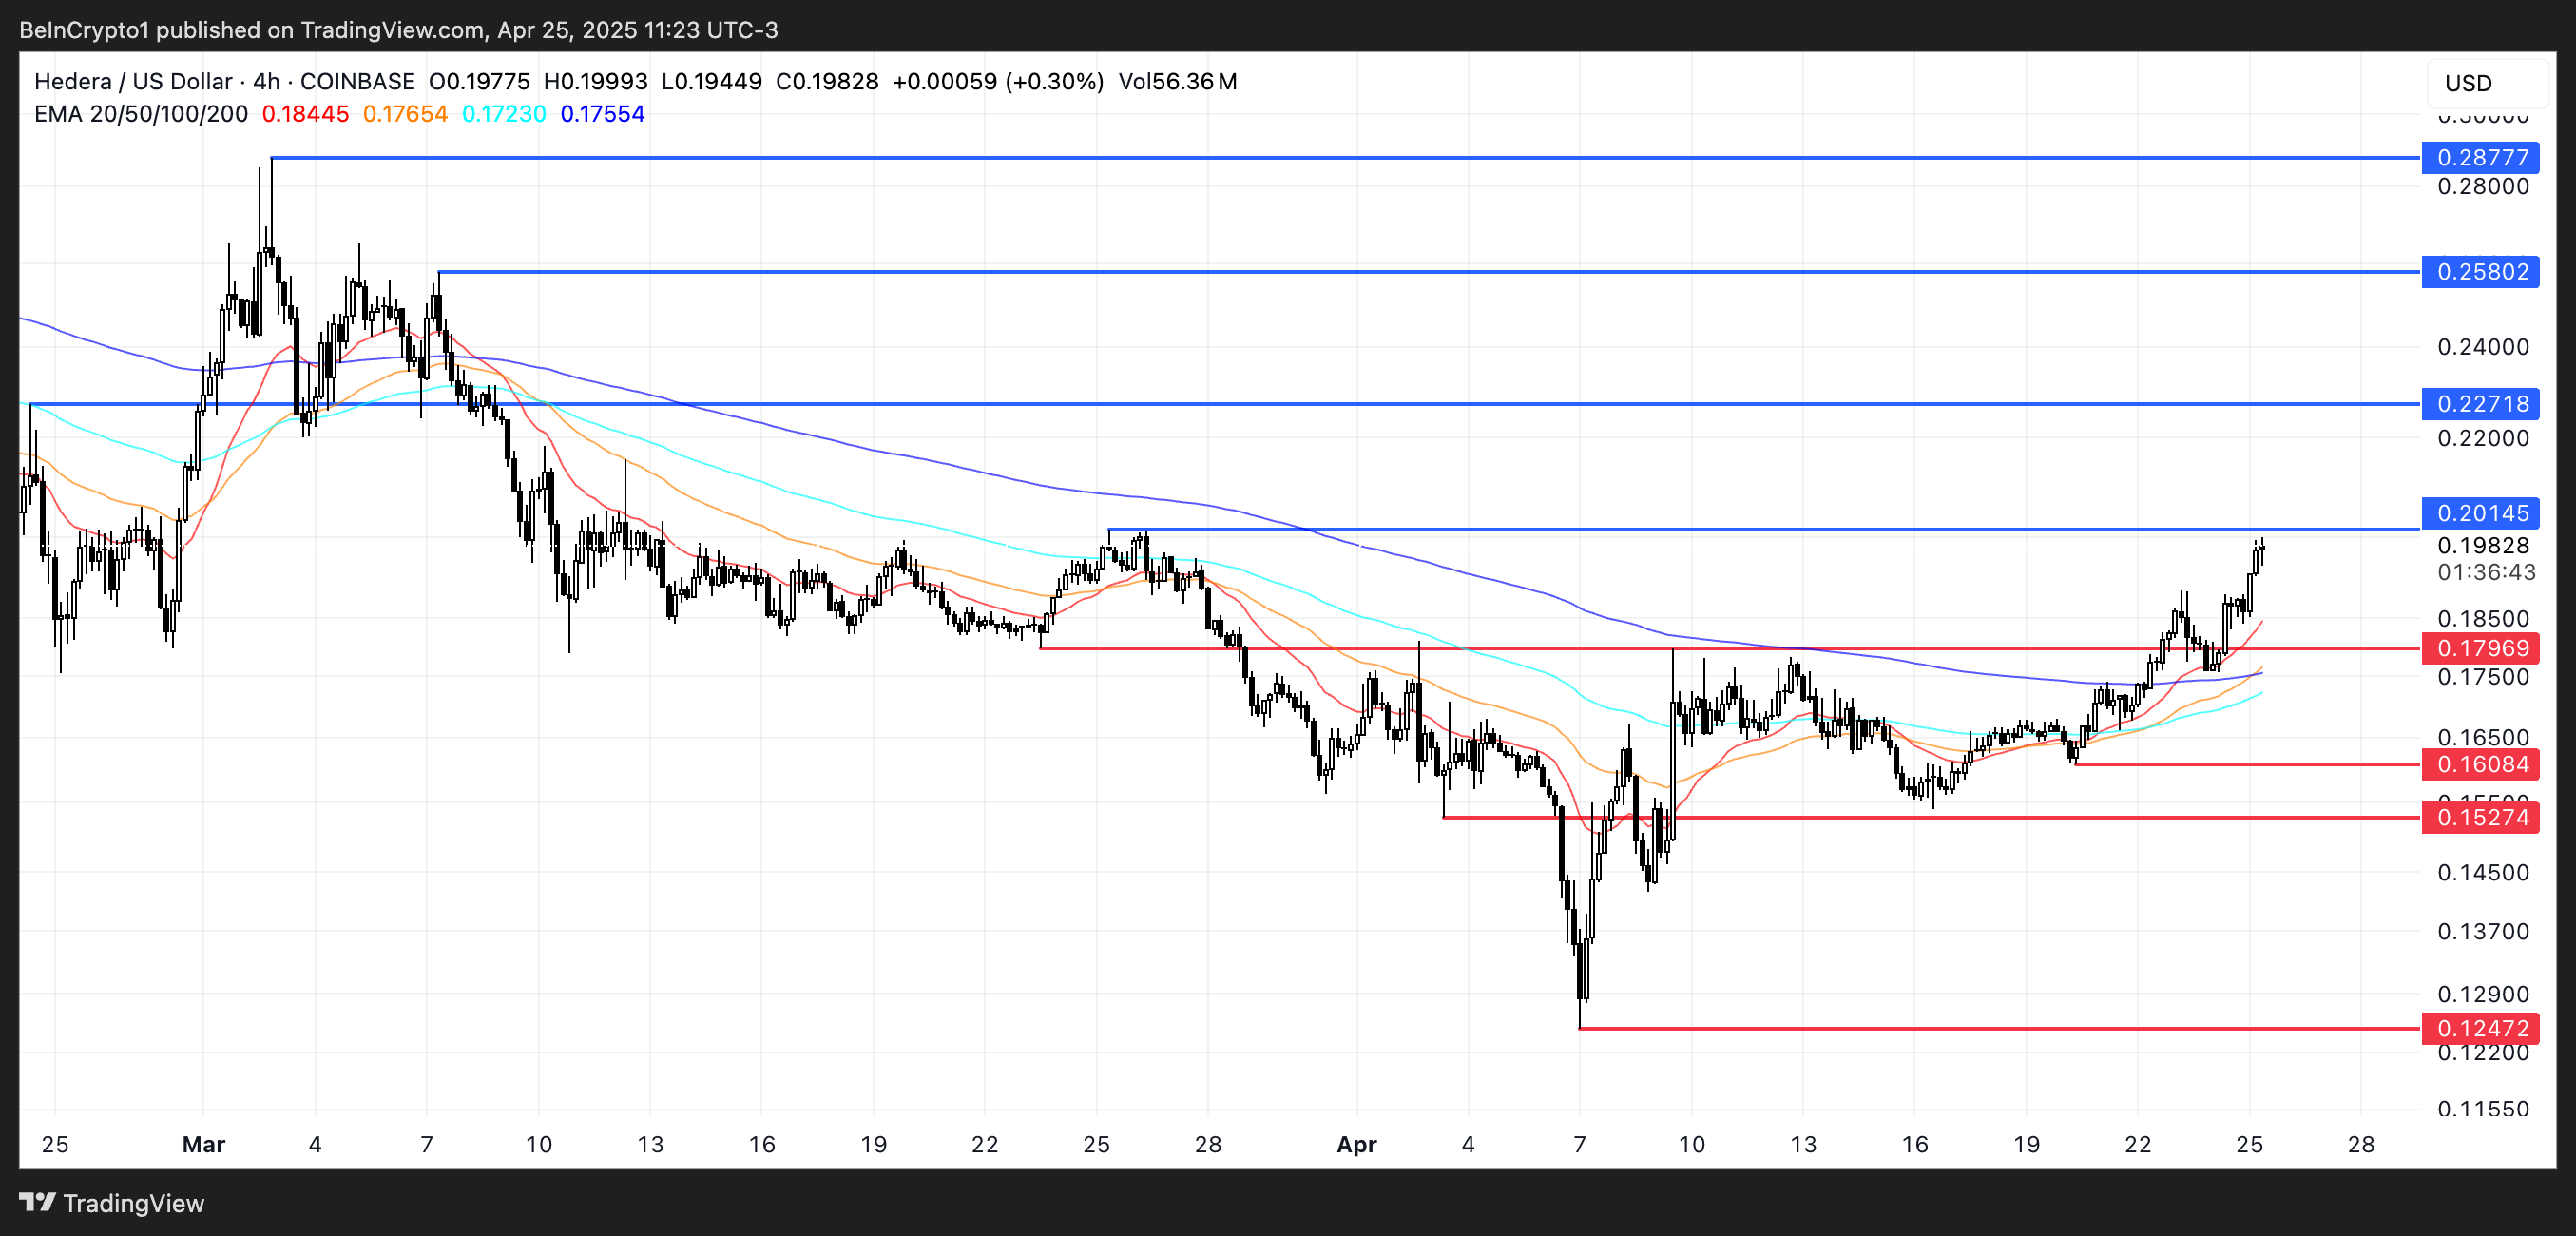
However, traders should also monitor downside risks. A test and failure of the $0.179 support could trigger a deeper decline.
In such a case, HBAR could drop to $0.16 and $0.152, which previously served as support zones.
If downward momentum accelerates, a drop to $0.124 is possible, with the current level becoming a critical battleground for short-term direction.


