Bitcoin (BTC) has been trading within a narrow range between $83,000 and $86,000 over the past five days, showing uncertainty in both price movements and momentum indicators.
The number of whale wallets has begun to decrease, but on-chain data still reflects high interest from large holders. Technically, BTC is entering an adjustment phase with weak moving average signals and mixed Ichimoku cloud readings.
Bitcoin Whale Retreat… Early Signal of Declining Confidence?
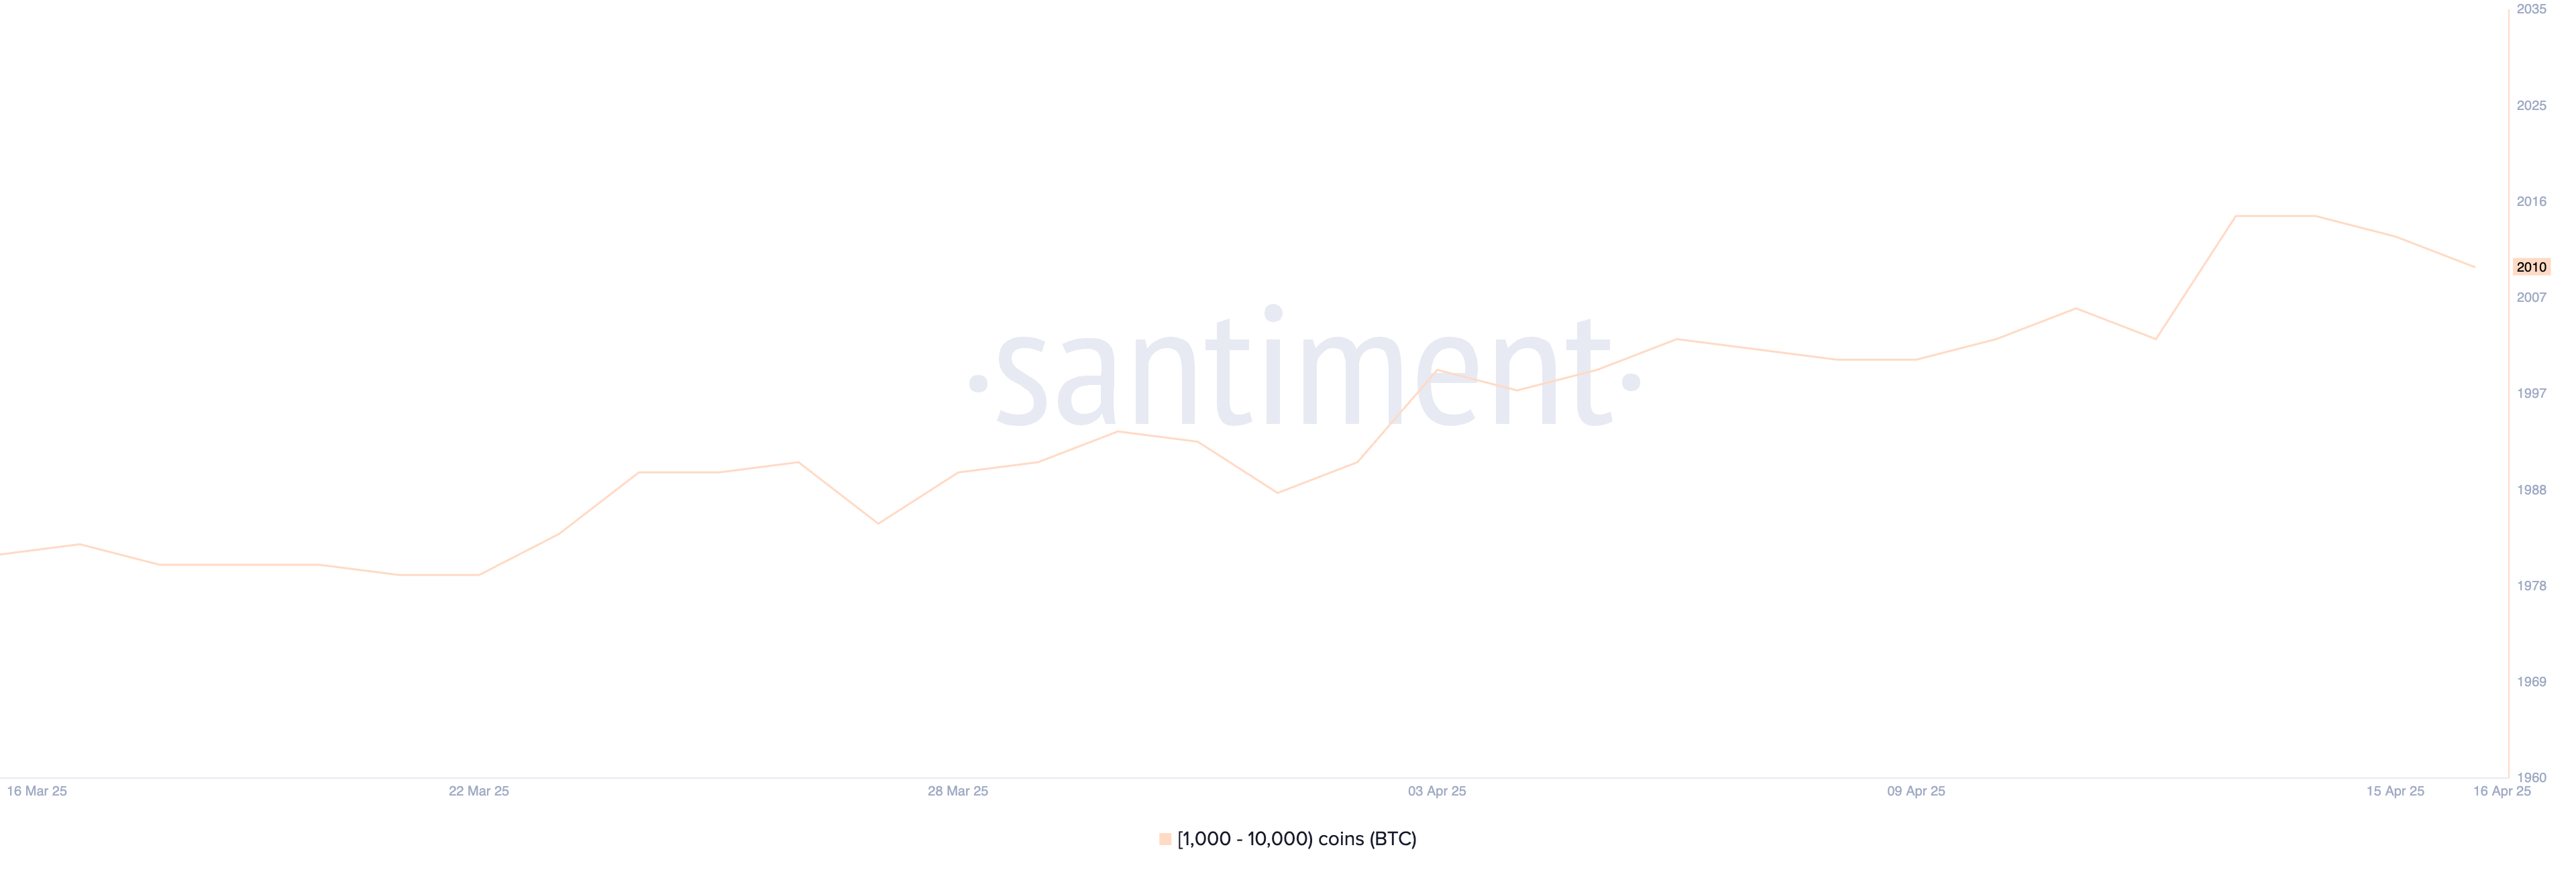
Bitcoin whales—wallets holding 1,000 to 10,000 BTC—have slightly decreased in recent days, dropping from 2,015 on April 14 to 2,010 on April 16.
This retreat occurred right after the indicator reached its highest level since May 2024, suggesting a potential sentiment change among large holders.
Although the decrease may seem small, changes in whale behavior often precede broader market trends, making even small changes worth noting.
Whale activity is an important on-chain signal. These large holders can significantly impact market liquidity and price direction.
An increase in whale wallets reflects accumulation and long-term confidence, while a decrease may suggest strategic profit-taking or risk-averse behavior.
The recent decline from local highs could indicate that some whales are reducing positions as market uncertainty increases. If numbers continue to decrease, institutional confidence may weaken, potentially putting short-term pressure on Bitcoin prices.
Bitcoin Stagnating Near Ichimoku Conversion Line… Momentum Weakening
Bitcoin's Ichimoku chart shows a consolidation period, with current prices trading near the flat conversion line (blue line) and baseline (red line).
This alignment suggests a lack of short-term momentum, with both lines moving sideways, indicating a balance between buyers and sellers.
The future cloud (Kumo) shows an upward trend, with Leading Span A (green cloud boundary) above Leading Span B (red cloud boundary), but the distance between them is relatively narrow.
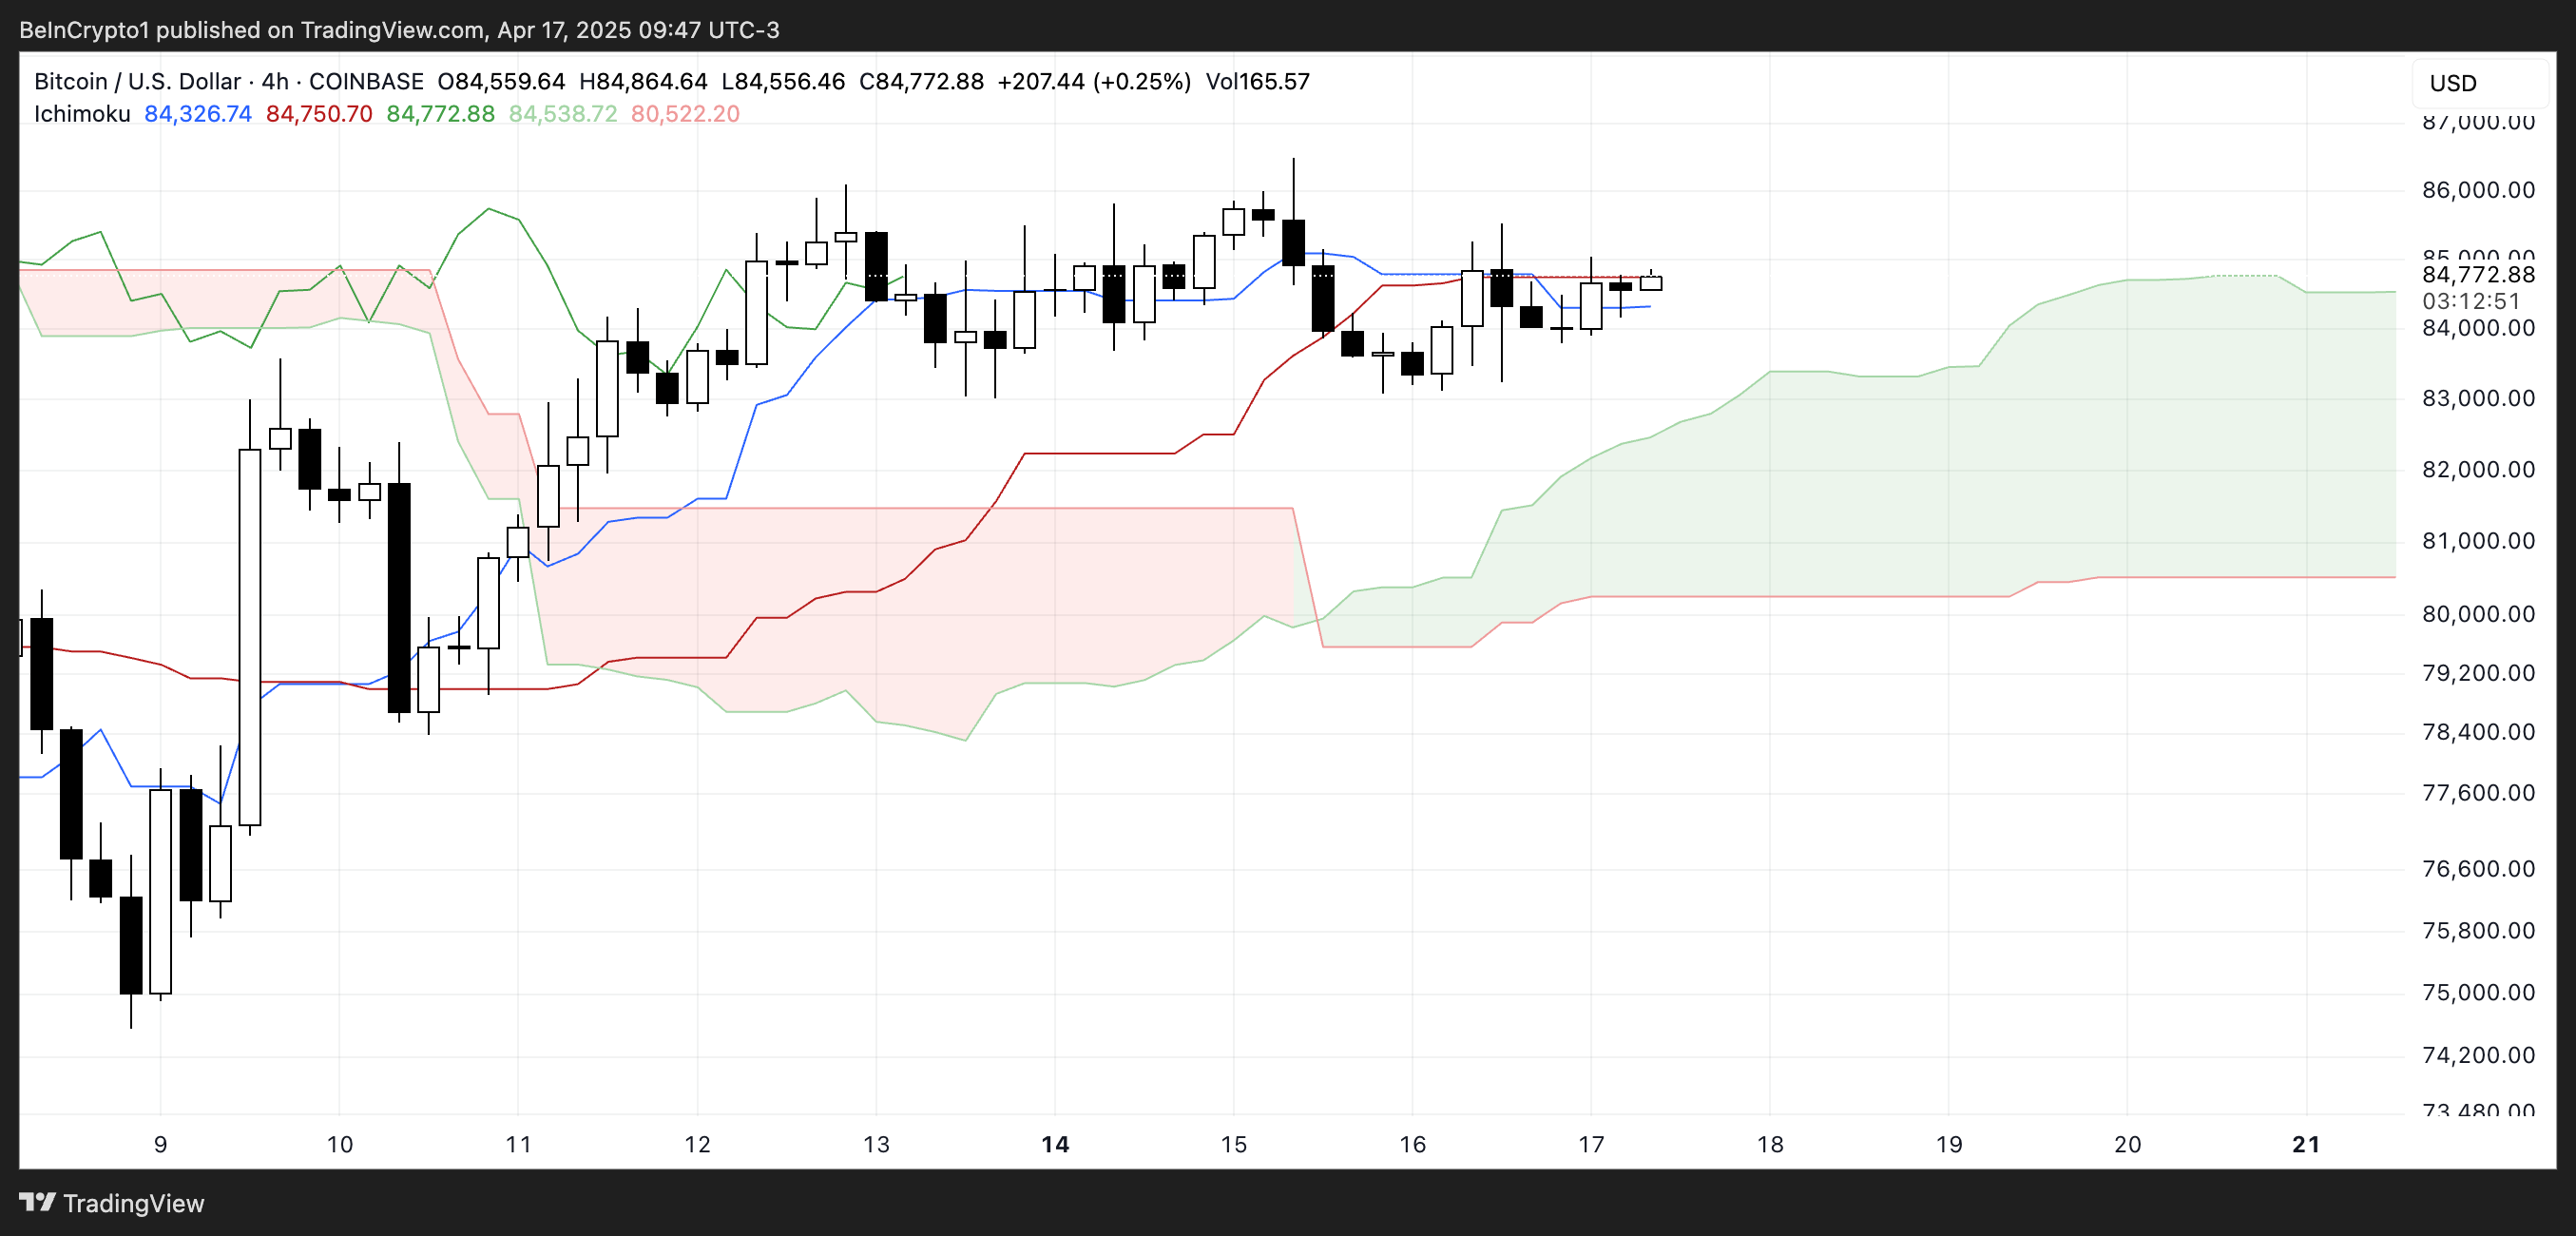
This implies current weak upward momentum. The price is positioned just above the cloud, which is a positive signal, but the trend remains uncertain unless it clearly breaks through the conversion line and recent highs.
The Chikou Span (lagging line) overlaps with recent candles, reinforcing the sideways movement.
Overall, Bitcoin remains in a neutral to slightly bullish area, but stronger momentum is needed to confirm a clear trend direction.
Bitcoin Seeking Direction… Approaching Critical Levels
Bitcoin's moving averages are currently flat, indicating a weak and uncertain trend. Price movements show hesitation, with both buyers and sellers lacking confidence.
If the support level at $83,583 is tested and fails to hold, the market may enter a sharper correction, targeting the next support level at $81,177.
Falling below that could see Bitcoin price drop below the psychological $80,000 level, with $79,890 potentially becoming the next possible downside target.
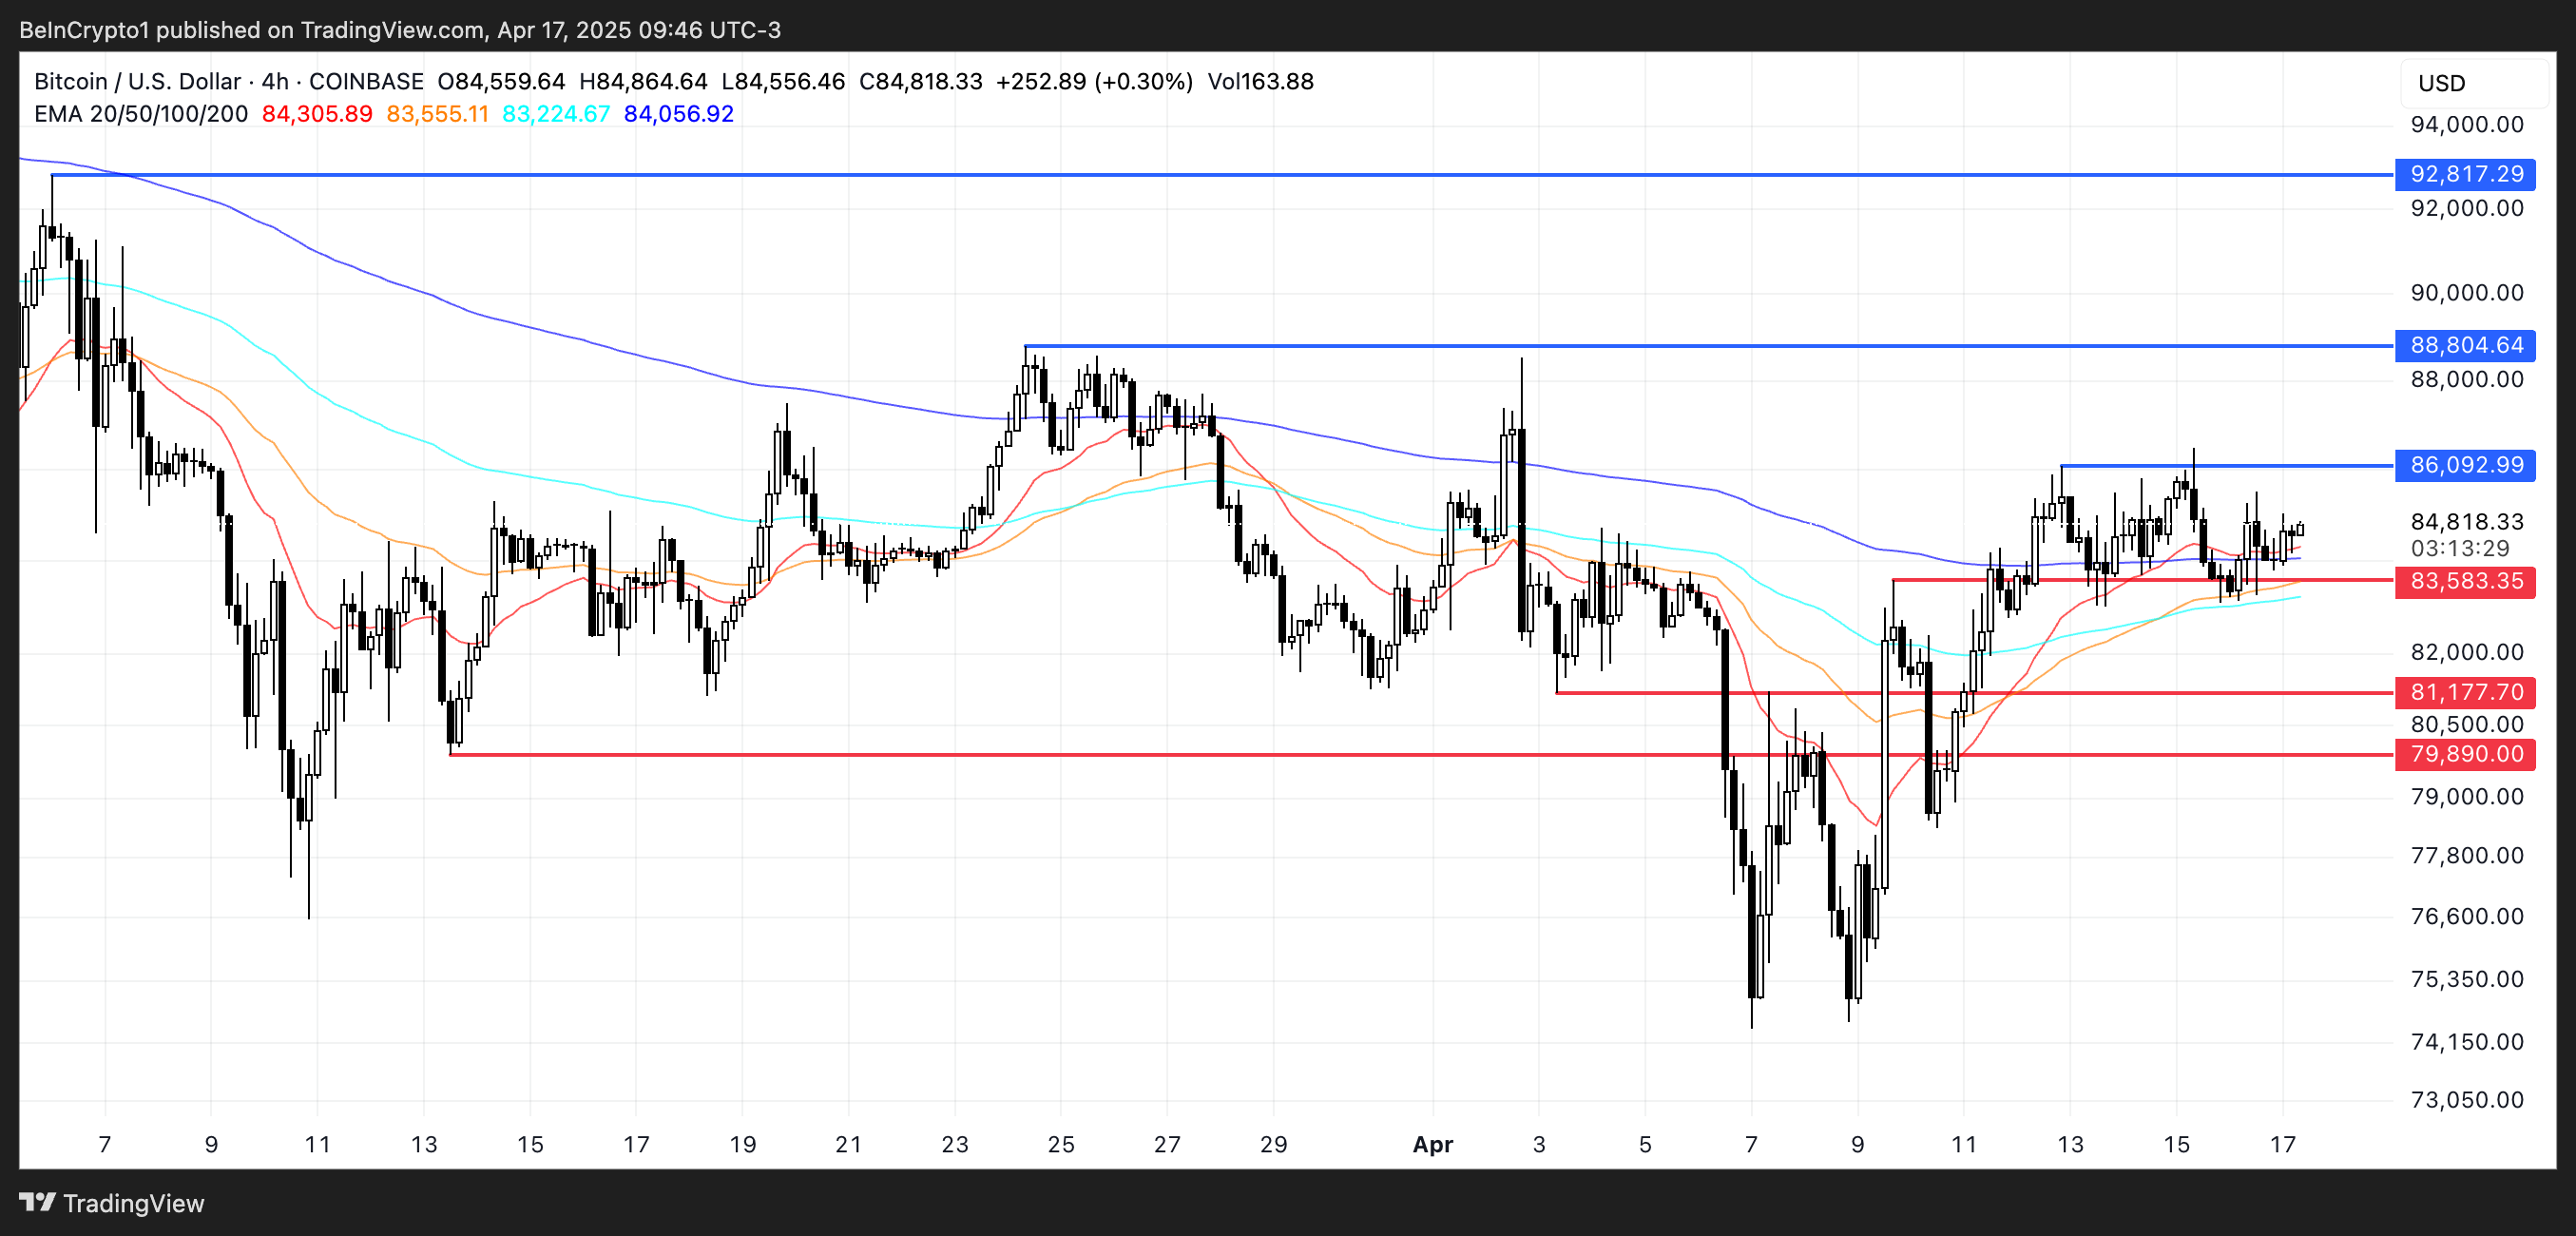
However, if buyers regain control, Bitcoin could switch to recovery. The first major resistance is at $86,092, and breaking this level could restart upward momentum.
The next upward target would then be $88,804, with $92,817 if the trend strengthens further.
Reaching this level would break $90,000 for the first time since March 7, potentially reigniting interest from both retail and institutional investors.