

I. Data Background: An Inflation Narrative Reconstructed by Tariffs
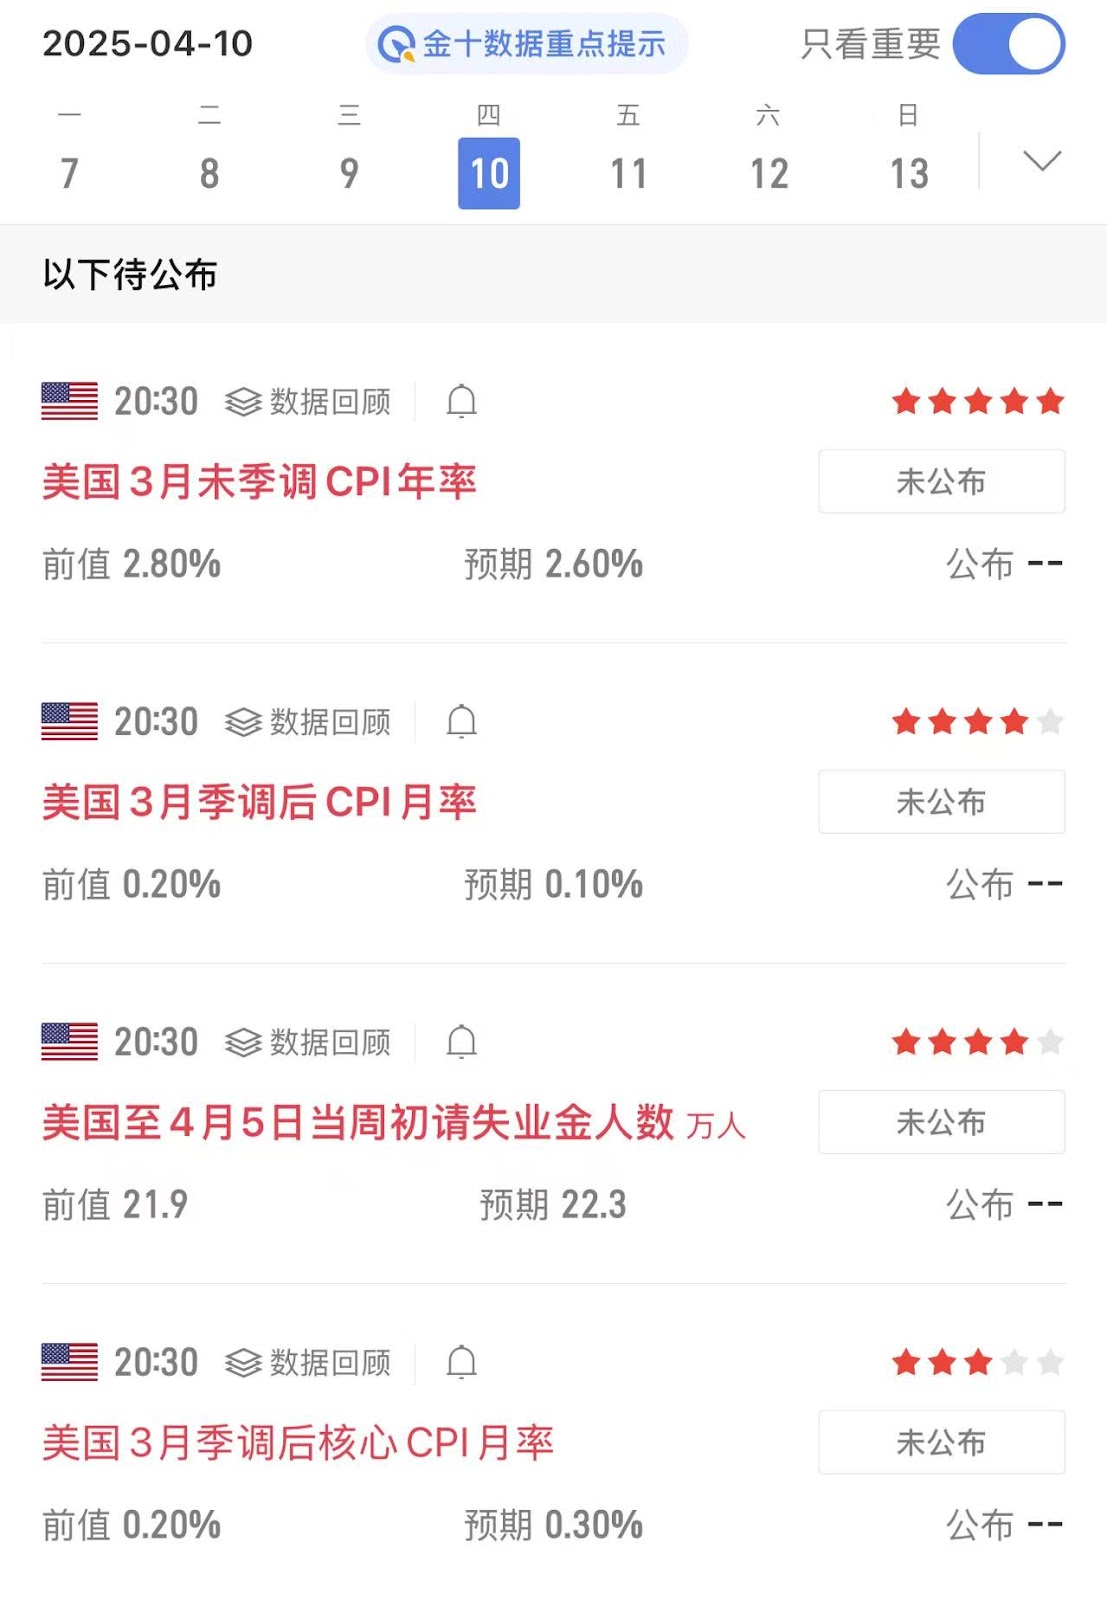
On the evening of April 10, 2025, at 20:30, the U.S. Bureau of Labor Statistics will release the March CPI data. Although this report has not yet fully reflected the 10% base tariff and 125% high tariff on China that took effect on April 2, it is viewed as a "baseline test" before the comprehensive implementation of the new tariff policy. According to market expectations, the year-on-year CPI growth rate in March will drop from 2.8% in February to 2.6%, and the core CPI month-on-month rate may slightly increase to 0.3% (previous value 0.2%), with used cars, rent, and service prices still being key variables.
The timing of this data release is extremely sensitive.
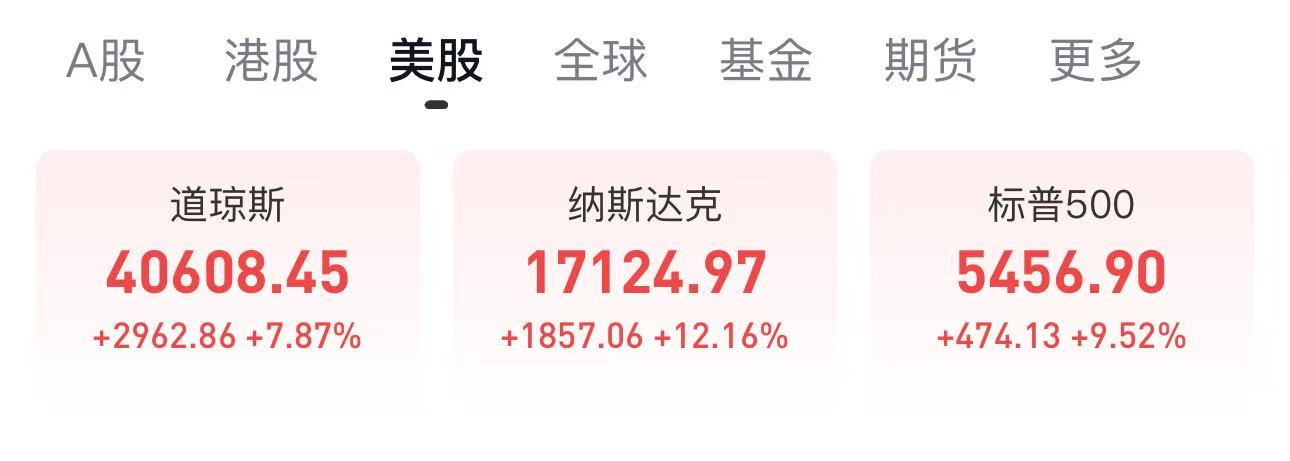
The Trump administration announced a 90-day tariff suspension for countries other than China on April 9, which temporarily eased market panic (the three major U.S. stock indexes rose by the highest single-day rate since 2008), but policy ambiguity still exists - analysts point out that the difference in wording between "suspension" and "reduction" may lay the groundwork for subsequent market volatility. Meanwhile, the Federal Reserve's March meeting minutes show that officials are highly alert to the "double risk" of rising inflation and economic slowdown, but emphasize a wait-and-see stance of "data-dependent decision-making".
II. Structural Inflation: The "New Battlefield" of Commodity and Service Divergence
Although falling energy prices provide support for overall CPI cooling, the resilience of core inflation cannot be ignored. UBS research shows that March data may initially reflect the price transmission effect of February tariffs on some commodities, especially the clothing category accounting for 20% of Chinese imports.
Deutsche Bank further points out that consumer "panic buying" before tariffs take effect has pushed up prices of durable goods such as automobiles, a trend that may continue in the coming months.
Historical Comparison: In the 2018-2019 tariff event, price transmission averaged a 3-6 month lag, and the current market expects the CPI "tariff impact peak" in May-August.
If core commodity inflation rebounds beyond expectations in March, it may strengthen investors' concerns about the "stagflation spiral" - cost-driven inflation coexisting with economic slowdown, forcing the Federal Reserve into a dilemma between rate cuts and fighting inflation.
III. Crypto Market Logic: From "Safe Haven Narrative" to "Liquidity Game"
1. Short-term Volatility: The "Non-linear Association" of CPI Data and Market Sentiment
In the past two weeks, the net inflow of Bitcoin to Binance surged by 22,106 coins (worth $1.82 billion), creating the highest single-week record since 2025.
CryptoQuant analyst Maarten Regterschot believes this phenomenon reflects two investor strategies under macro uncertainty: first, pre-positioning for volatility arbitrage potentially triggered by CPI data; second, hedging against fiat currency depreciation risk caused by tariff policies.
Historical data shows that the average volatility of Bitcoin on CPI announcement days reaches ±7.2%, and the current options market's implied volatility has risen to 85%, indicating traders are betting on violent price fluctuations.
If CPI is below expectations (such as year-on-year 2.5%), it may trigger the chain of "rate cut expectations rising - US dollar weakening - risk asset rebound", pushing Bitcoin to challenge the key resistance level of $85,000; conversely, if core inflation remains stubborn, the market may return to the "hawkish Federal Reserve" narrative, with a short-term exploration of the $78,000 support.
2. Medium-term Pattern: The "Time Race" of Tariff Policy and Liquidity Expectations
The core contradiction in the crypto market is the overlap of the 90-day tariff suspension window and the probability of the Federal Reserve cutting rates in June (currently 54% according to CME data).
This stage may present two paths:
- Optimistic Scenario: CPI continues to cool (March 2.6% → April 2.4%), the Federal Reserve starts rate cuts in June, and improved US dollar liquidity directly benefits crypto assets. According to the Bloomberg model, if rate cuts reach 75 basis points this year, Bitcoin's market cap ratio may rise from the current 42% to 50%, reproducing the "loose cycle" trend of 2020.
- Pessimistic Scenario: Commodity inflation caused by tariffs becomes prominent in May-June data, core CPI returns to above 3.2%, forcing the Federal Reserve to postpone easing. At this time, the crypto market will rely on its "safe-haven attributes", forming a linkage with gold and US Treasury bonds. It's worth noting that gold has broken through $3,100 before the CPI announcement, creating the largest single-day increase since March 2020. If Bitcoin can maintain a positive correlation with it, it may consolidate its "digital gold" status in the "stagflation trade".
IV. On-chain Data and Institutional Trends: Undercurrents of "Smart Money"
1. Exchange Flow Anomalies
Binance's Bitcoin reserves increased by 59,000 coins in 12 days, but Swyftx analyst Pav Hundal points out that some inflows may come from exchange hot wallet reallocation, rather than pure selling.
Glassnode data shows that the number of addresses holding over 1,000 BTC has grown 4.2% in the past month, suggesting whale accounts are buying the dip.
2. Derivatives Market Signals
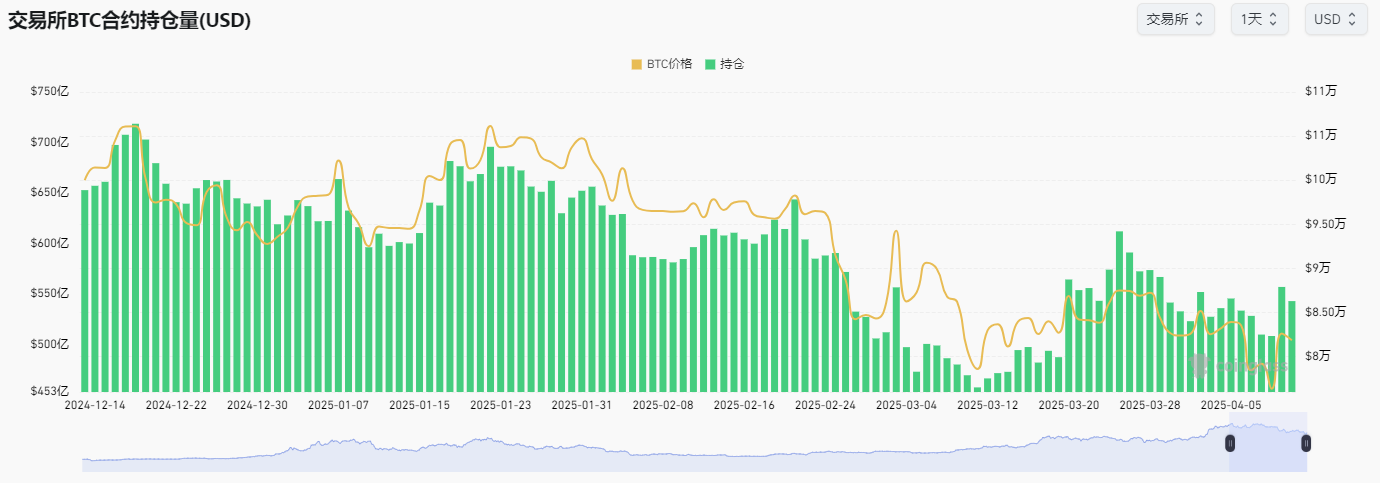
Bitcoin futures open interest reached $54.3 billion, far exceeding the previous 480 billion dollars at the same price, meaning traders have increased their positions.
Meanwhile, Ethereum options IV skew (put/call) has risen to 1.3, indicating investors are more cautious about ETH's short-term risks - consistent with the technical pullback pressure ETH faces after breaking through $1,600.
V. Investment Strategy: Finding Alpha in "Expectation Differences"
1. Event-driven Trading
- At Data Announcement Moment: If CPI year-on-year ≤2.5%, deploy BTC/ETH breakthrough strategy, with target prices referencing BTC $84,500, ETH $1,750; if CPI ≥2.8%, short to BTC $79,500, ETH $1,530.
- Term Structure Arbitrage: Utilize quarterly futures premium (currently 18% annually) and spot basis, rolling positions after volatility declines.
2. Liquidity Management Iron Rule
- Leverage control below 3x, reserve 30% cash to cope with possible "secondary bottom" after CPI.
- Use "ladder-style profit-taking", partially reducing positions at BTC $85,000, $90,000, $100,000 to avoid over-reliance on a single target price.
VI. Epilogue: Crypto Market's "Resilience Test" and Historical Opportunity
The macro landscape of 2025 is being reconstructed: on one side is the Trump tariff policy "gray rhino", on the other is the "clear card game" of Federal Reserve monetary policy turning. The March CPI data may be just a prelude, but its revealed inflation resilience, policy transmission speed, and market expectation differences will provide a new opportunity for value discovery in crypto assets.
Whether it's "loose restart" or "stagflation deepening", Bitcoin's underlying logic remains unchanged - it is both a barometer of global liquidity expectations and a hedge against fiat system trust crisis. As Cao Renchao said: "Bad market conditions, good investment" - when the market calculates the worst expectations in panic, the seeds of excess returns have already been planted.


