

Written by: Biteye
Over the past decade, the bull peaks and bear bottoms of BTC have been a reflection of the Federal Reserve's interest rate policies.
Tops often occur when rate hike expectations are strongest
Bottoms are typically accompanied by expectations of rate cuts
Now, the market stands at a three-path crossroads:
Rate hike restart → Second bottom?
Rate cuts in the second half → Volatility before peak?
Mid-year rate cuts → Bull market acceleration?
These paths will determine BTC's next move.
This article will break down BTC trends under three scenarios, helping you understand the macro and price gaming logic in one go.
I. Federal Reserve's 10-Year Rate Policy Review: How Did BTC's "Top" and "Bottom" Echo?
Over the past decade (around 2015-2025), the Federal Reserve went through a complete cycle of rate hikes, cuts, re-hikes, and pauses. Reviewing this history, we found intriguing correlations between BTC price turning points and Fed policy nodes, especially the "advance reaction" of market expectations.
Conclusion first:
1. BTC bull tops often lead the start or acceleration of rate hikes, with markets trading tightening expectations in advance.
2. BTC bear bottoms usually appear in the later stages of rate hikes, during rate hike pauses, or before the start of rate cut cycles. Markets seek bottoms during the most pessimistic or anticipated loosening periods.
3. Quantitative easing (QE) or rapid rate cuts are crucial catalysts for bull markets.
Here's a comparison table of the Fed's major rate policies and BTC's key trends over the past decade:
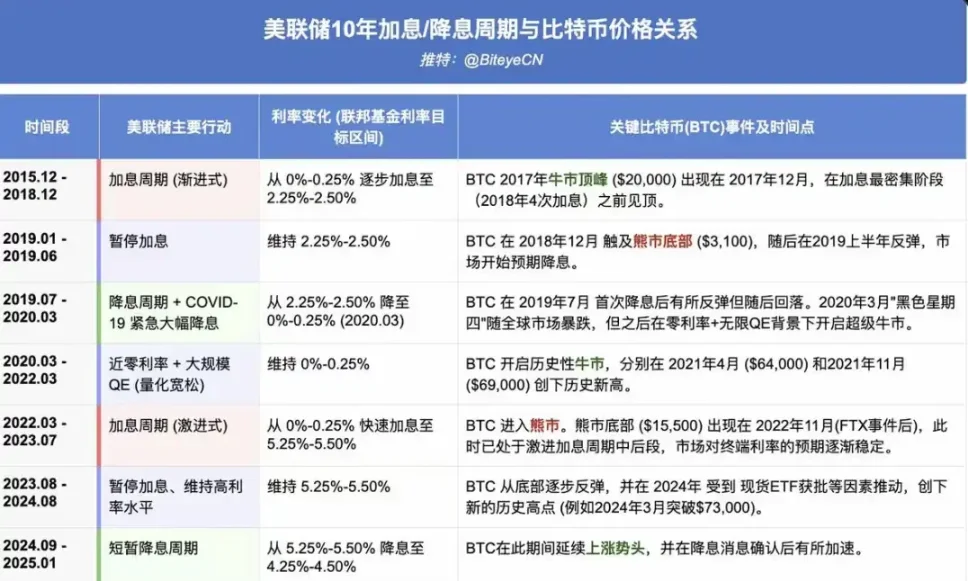
This table clearly shows the "time difference" between BTC price key turning points and Fed policy cycles. Whether the 2017 or 2021 bull market peaks, they occurred before the rate hike "hammer" truly fell or during the strongest rate hike period. Bear market bottoms, meanwhile, often coincided with expectations of rate cuts.
Currently, we are in a "rate hike pause" + "brief rate cut" platform period, with the market waiting for the next clear directional signal - whether further rate cuts can lead to a quantitative easing "massive liquidity" phase.
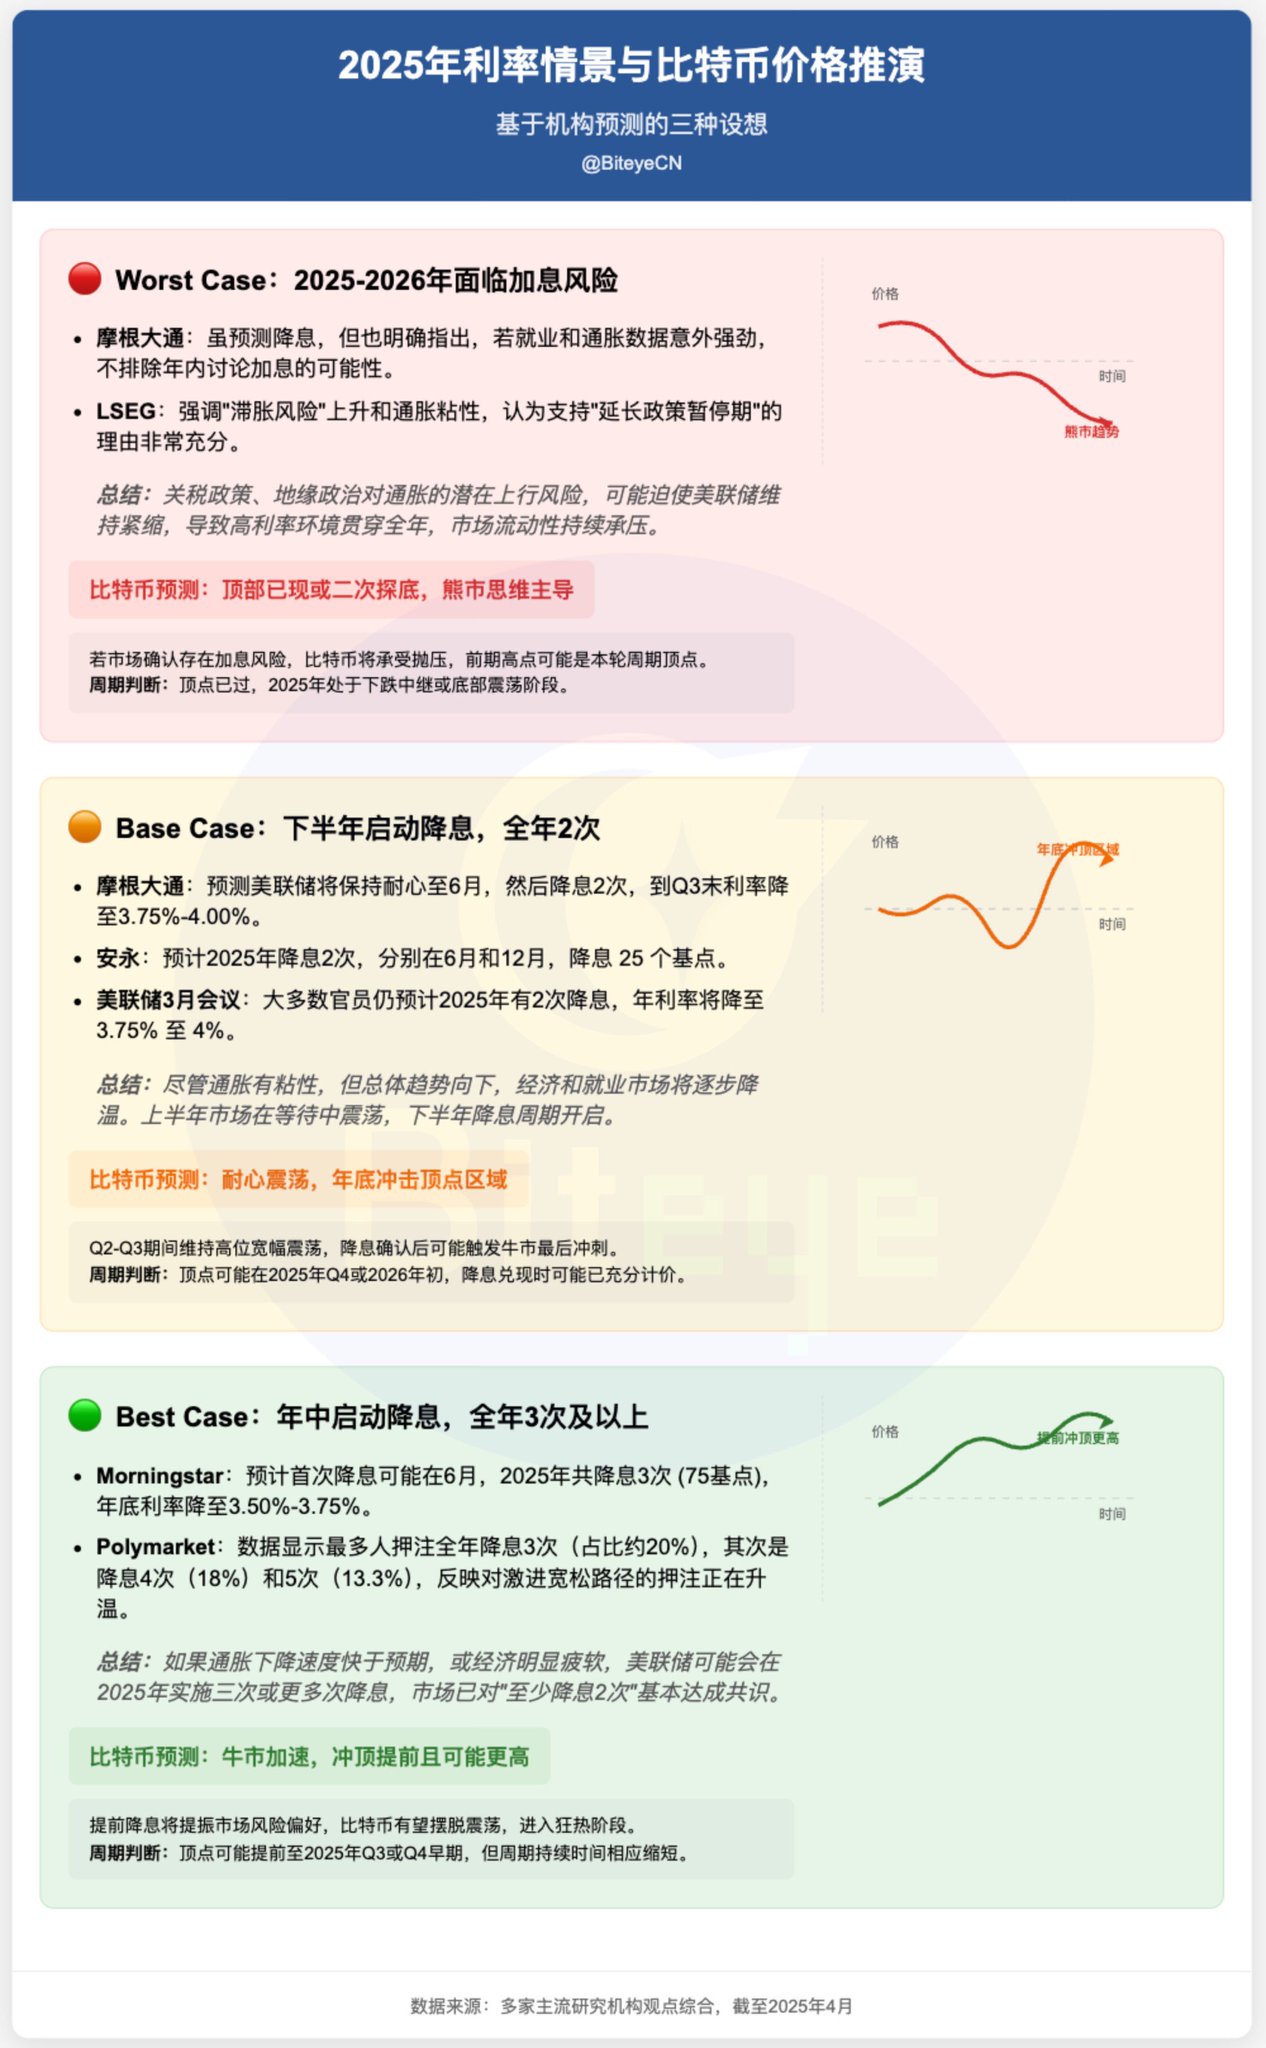
II. Rate Projection: Three Scenarios Based on Institutional Predictions
Currently (April 2025), there are significant market divergences about the Fed's next move. Combining recent views from mainstream research institutions, we've summarized three possible scenarios:
1. Worst Case: Rate Hike Risk in 2025-2026
J.P. Morgan (March early report): While predicting rate cuts, they clearly pointed out that if employment and inflation data are unexpectedly strong, discussing rate hikes within the year is not ruled out.
LSEG (early April report): Emphasizes rising "stagflation risk" and inflation stickiness, believing there are very sufficient reasons to "extend the policy pause period".
Tariff policies and geopolitical potential inflation risks might force the Fed to maintain tightening, potentially leading to a high-interest environment throughout the year, continuously pressuring market liquidity.
2. Base Case: Rate Cuts in the Second Half, Two Cuts Annually
J.P. Morgan (March early report): Predicts the Fed will be patient until June, then cut rates twice, bringing rates to 3.75%-4.00% by Q3 end.
EY (March report): Expects two rate cuts in 2025, in June and December, each by 25 basis points.
Fed March meeting: Most officials still predict two rate cuts in 2025, with annual rates dropping to 3.75% to 4%.
These views believe that despite sticky inflation, the overall trend is downward, with the economy and job market gradually cooling. The market will oscillate while waiting in the first half, with the rate cut cycle opening in the second half.
3. Best Case: Mid-Year Rate Cuts, Three or More Annually
Morningstar (March 28 report): Expects the first rate cut possibly in June, with three cuts (75 basis points) in 2025, bringing year-end rates to 3.50%-3.75%.
Plymarket: According to Polymarket data, the most bet scenario is three annual rate cuts (75 basis points), accounting for about 20%. Next are four cuts (100 basis points) and five cuts (125 basis points), at 18% and 13.3% respectively, reflecting some market bets on aggressive easing paths. The scenario of "only two cuts" that was most favored early in the year has now fallen to around 13% support. Overall, the market basically reaches a consensus on "at least two rate cuts in 2025", but there are still large divergences about whether a more powerful easing cycle will occur, with expectations not yet anchored.
These views believe that if inflation declines faster than expected or the economy shows clear weakness, the Fed might implement three or more rate cuts in 2025.
III. BTC Price Projection: Price Trends Under Three Rate Scenarios
Based on the above three well-founded rate scenarios, we'll project BTC's upcoming price trends:
1. Worst Case (Rate Hike Risk in 2025-2026): Top Already Seen or Second Bottom, Bear Market Mindset Dominates
Trend Projection: If the market confirms rate hike risks, BTC will likely face selling pressure in Q2 2025 and beyond. Previous highs might be the cycle's final top. Market sentiment will turn pessimistic, potentially causing deep retracements, testing lower key supports, and not ruling out a second bottom.
Cycle Top Judgment: The top is basically confirmed, with 2025 likely in a downward continuation or bottom oscillation.
2. Base Case (Rate Cuts in Second Half, Two Annually): Patient Oscillation, Year-End Push Towards Top Area
Trend Projection: During Q2-Q3 while waiting for clear rate cut signals, BTC will likely maintain high-level wide oscillation. Market sentiment will fluctuate with data. Once rate cut expectations are confirmed and implemented in late Q3/Q4, it might trigger the bull market's final sprint, but this is more likely an "last train" move driven by sentiment and liquidity expectations.
Cycle Top Judgment: Possibly in Q4 2025 or early 2026, partially aligning with the halving cycle model. Note that when rate cut news is realized, the market might have fully priced it in, even causing a "sell the fact" pullback. The true price top might be when rate cut expectations are strongest but not yet fully implemented.
3. Best Case (Mid-Year Rate Cuts, Three or More Annually): Bull Market Acceleration, Earlier and Potentially Higher Top
Trend Projection: If the economy unexpectedly weakens, forcing early Fed rate cuts, it will greatly boost market risk appetite. BTC is expected to quickly break out of oscillation, launching a powerful offensive and driving the entire crypto market into a frenzy.
Cycle Top Judgment: Possibly advanced to Q3 or early Q4 2025. Earlier liquidity easing might push prices to higher levels, but the entire cycle's duration will correspondingly shorten.
IV. Summary
The Federal Reserve's rate decisions remain the global asset pricing anchor, especially for high-volatility assets like BTC. Although the market repeatedly jokes about being "beaten down", according to major mainstream institutions, we are currently at a critical point of expectation swings. While reducing positions, one might still keep a glimmer of hope.


