

Bitcoin price has mainly remained quiet over the past two months. Currently, it is trapped in an expanding descending wedge pattern on the chart. Despite several attempts, BTC has failed to break through important resistance levels.
However, historical trends and improved macro indicators suggest that a recovery may be approaching.
Bitcoin, Downtrend Better Compared to Past
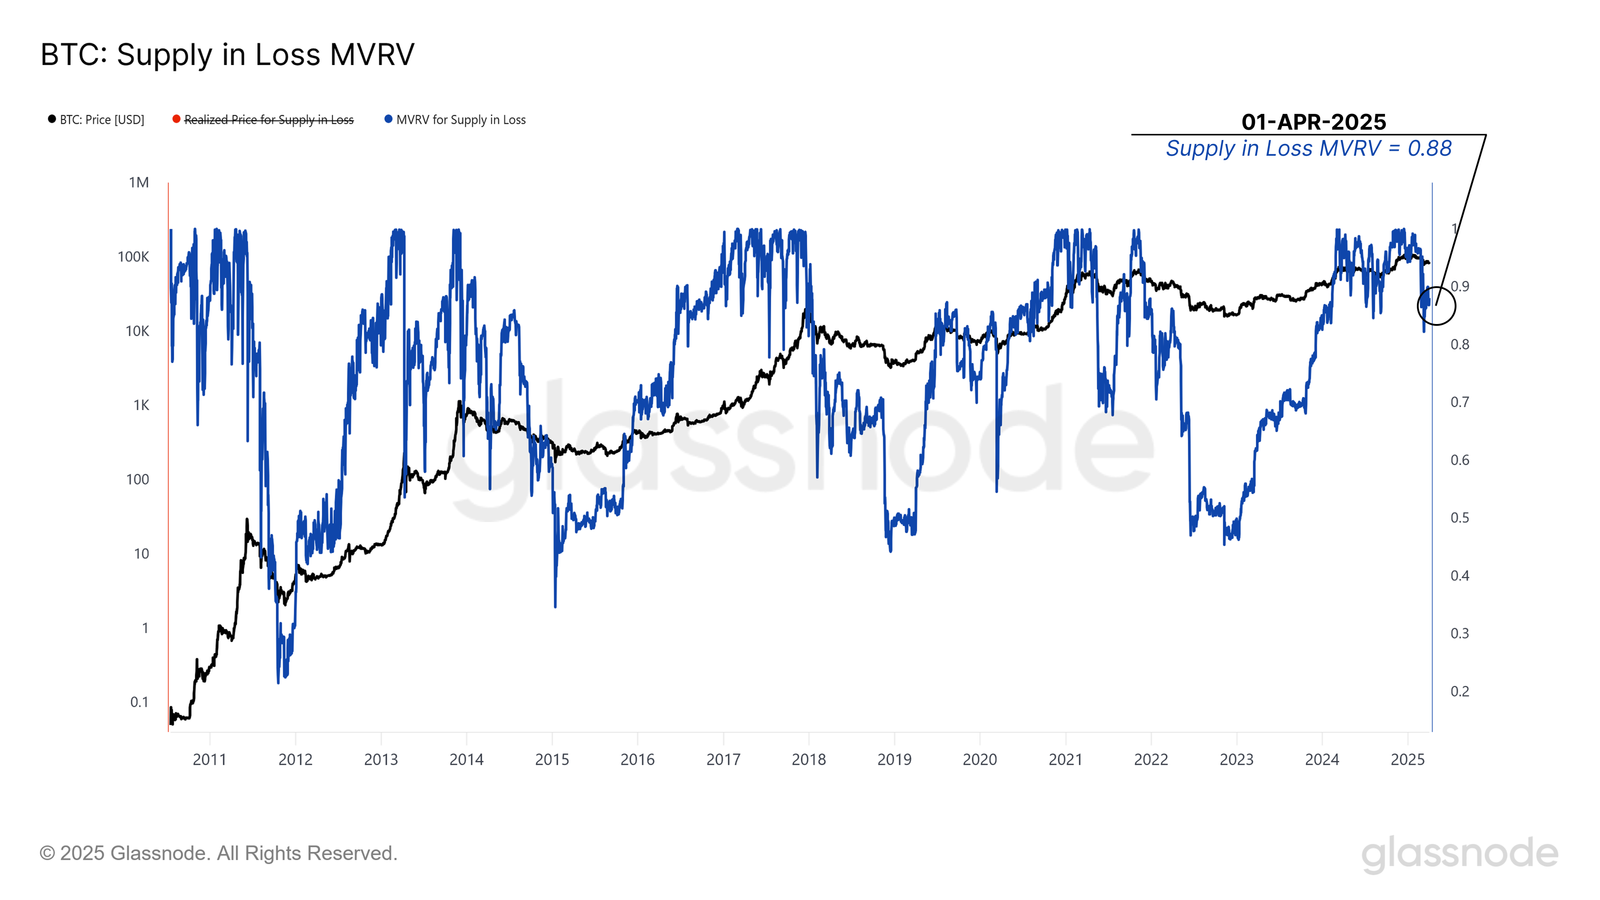
Bitcoin's Market Value to Realized Value (MVRV) supply dropped to 0.88 this week. This indicator highlights the degree of losses realized by the average BTC investor. While this level indicates losses, it is not as severe as in past major corrections like in 2018 or 2022. This suggests that the current downtrend is relatively mild compared to historical bear markets.
Moreover, the current weakness has not yet triggered widespread capitulation. Investor behavior indicates cautious optimism, and they could quickly transition to an accumulation phase if macro conditions improve. If past cycles are an indicator, BTC tends to rebound sharply when the MVRV ratio finds a bottom.
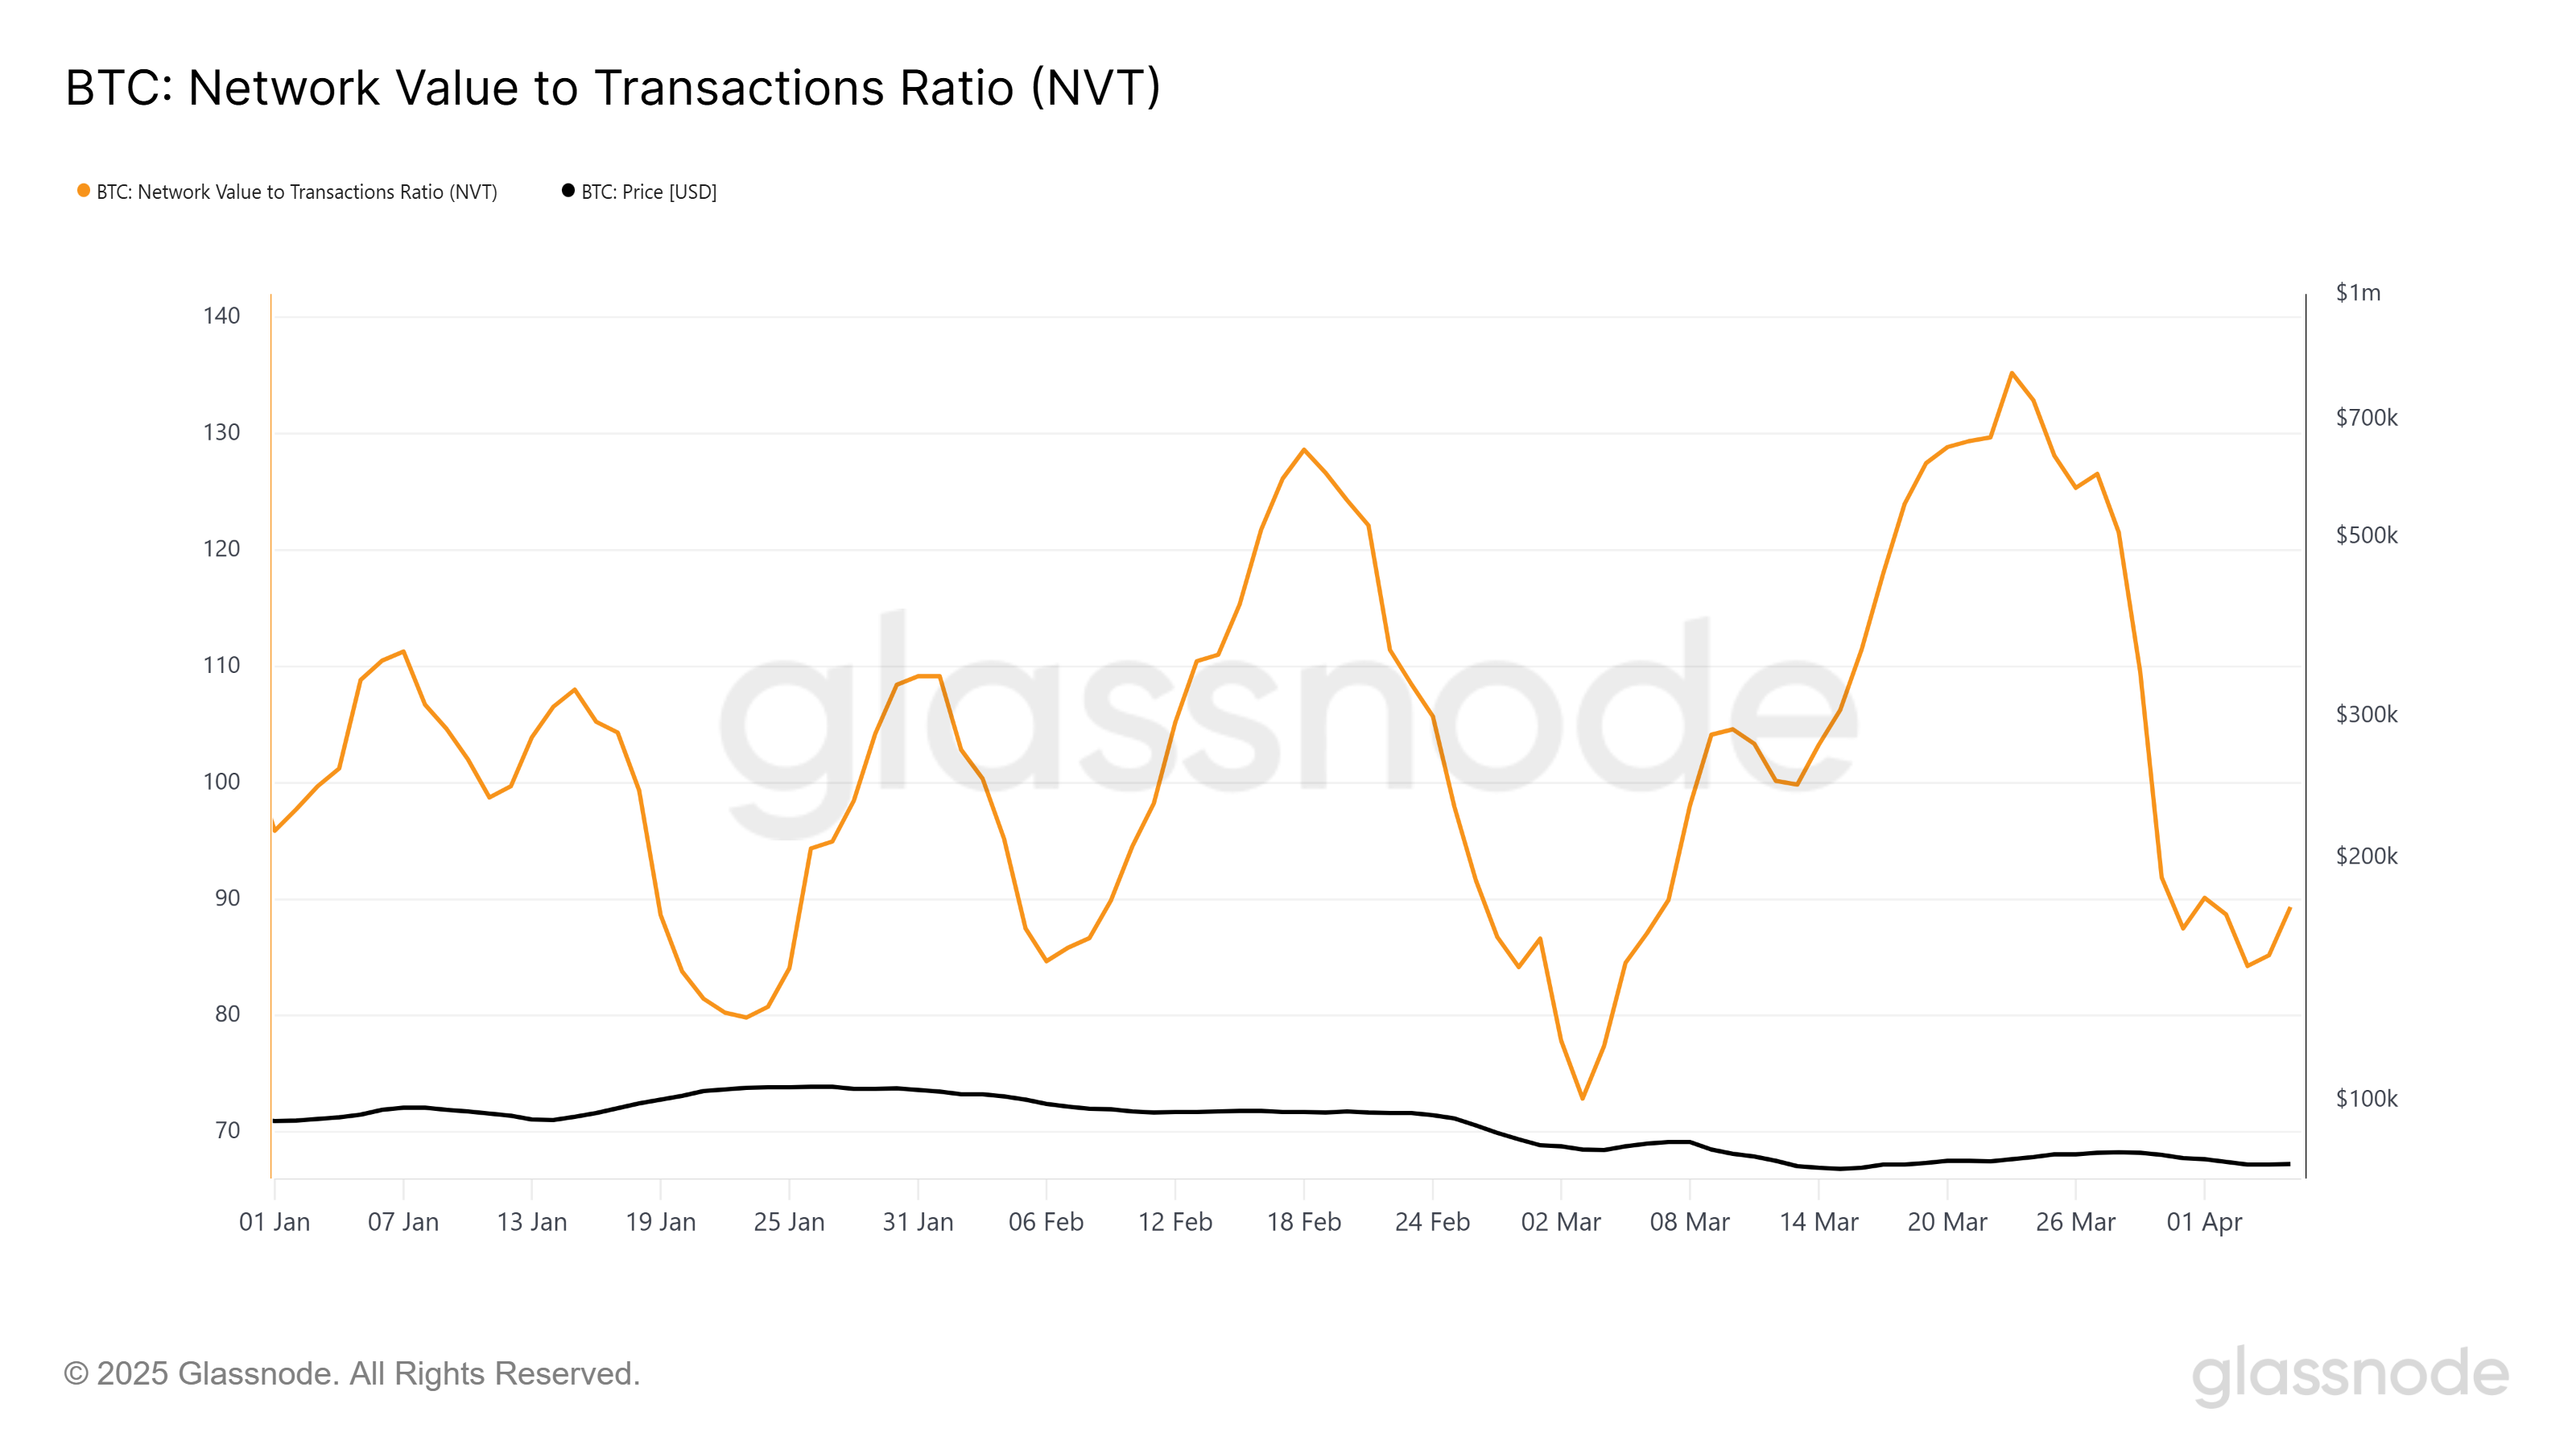
Bitcoin network valuation has significantly decreased over the past two weeks compared to transaction volume. This change indicates that network activity is aligning more closely with actual usage, and Bitcoin appears to be fairly valued. In previous cycles, similar declines occurred before substantial recoveries, highlighting potential upside.
The decline in valuation relative to utility suggests a reset of expectations. As trading activity catches up, it lays the groundwork for new upward momentum. The alignment of value and utility typically promotes price increases when sentiment shifts.
BTC Price, Recovery to $82,000 is Priority
Bitcoin is trading at $82,097 and attempting to maintain above the crucial $82,503 level. This level is essential for BTC to gather strength and break out of the descending wedge. A daily close above this level could trigger a short-term uptrend.
A confirmed breakout occurs when BTC recovers $85,000 as a support level. From that point, the price could rise to $89,800. If momentum continues, surpassing $90,000 is highly possible, which would restore confidence among waiting investors.

In a downtrend, failure to break above $82,503 could result in a pullback to $80,000. Falling below this level would invalidate the bullish setup. Continued losses could extend the wedge pattern and drag Bitcoin down to $76,741, further weakening the short-term outlook.


