

Bitcoin (BTC) is attempting to recover to the $90,000 level, rising more than 4% in the past 24 hours and over 5% in the past 7 days. The recent price rebound suggests strong upward momentum as technical indicators improve.
Traders are watching to see if Bitcoin can recover to $90,000 and establish a strong foundation for further increases. Several trend indicators like DMI, Ichimoku Cloud, and moving averages indicate a potential breakthrough.
BTC DMI, Buyers Completely Dominating
Bitcoin's DMI chart shows a significant increase in momentum. The ADX (Average Directional Index) rose to 18.24 today, a substantial increase from yesterday's 9.2, indicating an increase in the current trend's strength.
When ADX is below 20, it suggests a weak or range-bound market, so this rise could be an early signal of a developing trend.
ADX itself does not indicate the trend's direction but measures overall strength, and today's figure suggests momentum is beginning to increase.
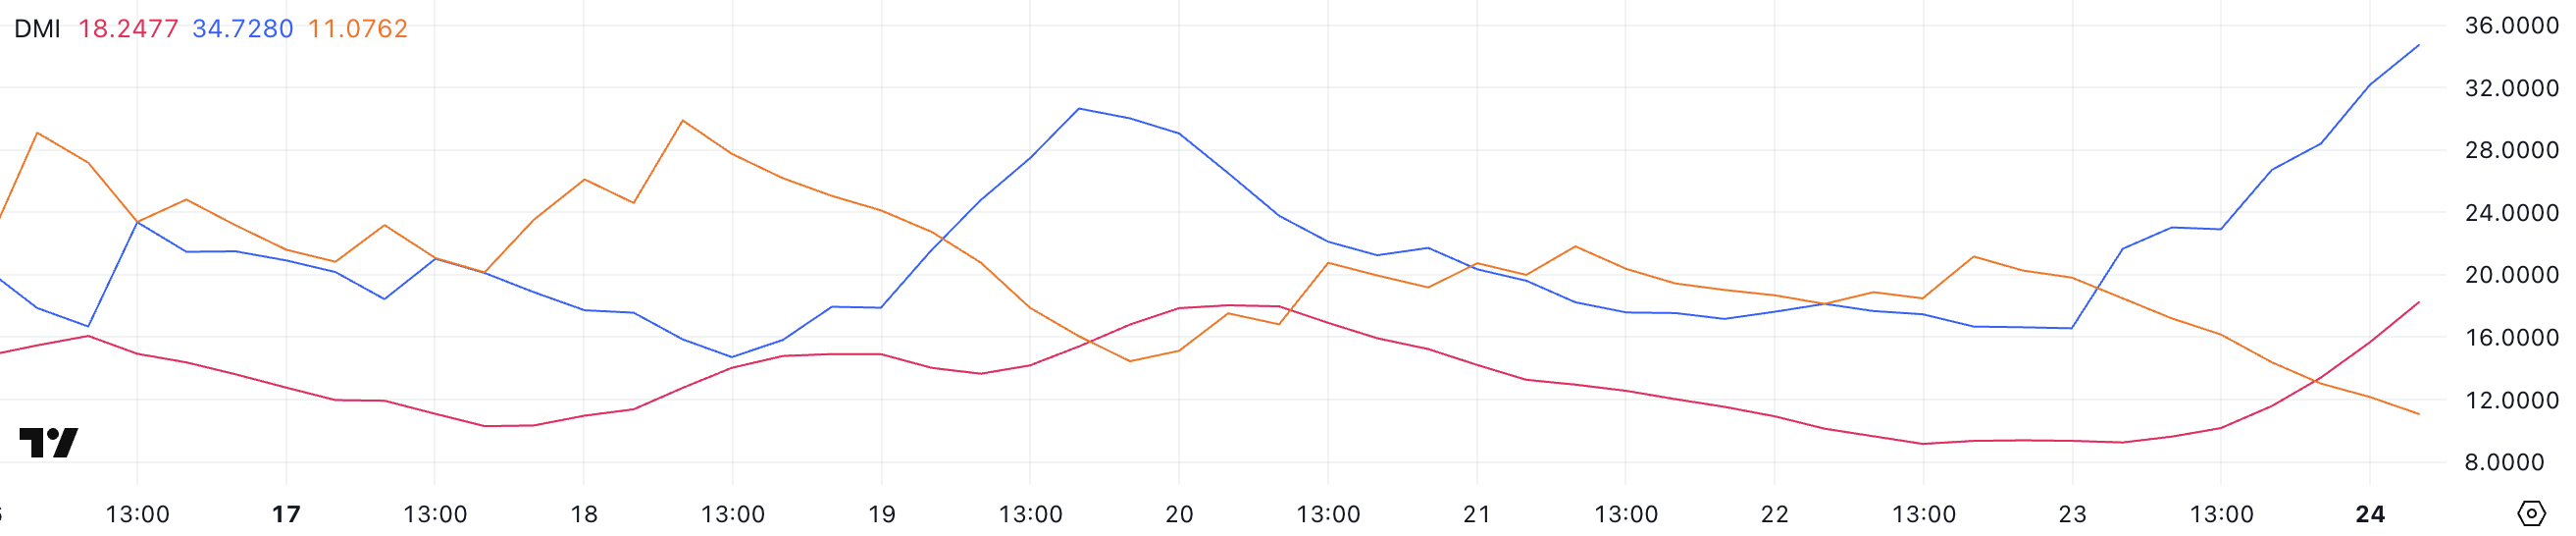
ADX is widely used to measure market trend strength. Generally, an ADX value below 20 indicates no clear trend, while 25 and above indicates a strong trend.
Along with ADX, +DI (Positive Directional Indicator) and -DI (Negative Directional Indicator) provide insights into trend direction. Currently, +DI has surged from 16.57 to 34.7, while -DI has decreased from 21.17 to 11.
This widening gap between +DI and -DI indicates buying pressure overwhelming selling pressure, suggesting Bitcoin's price could rise further in the short term if this trend continues. As the market transitions to a more decisive upward trend, Bitcoin ETFs are showing signs of recovery.
Bitcoin Ichimoku Cloud, Forming Bullish Signal
Bitcoin's Ichimoku chart shows the conversion line (blue) and base line (red) crossing in an upward pattern. The fast conversion line moving above the slow base line indicates a momentum change.
These lines have separated and then converged again, indicating reinforced trend conditions.
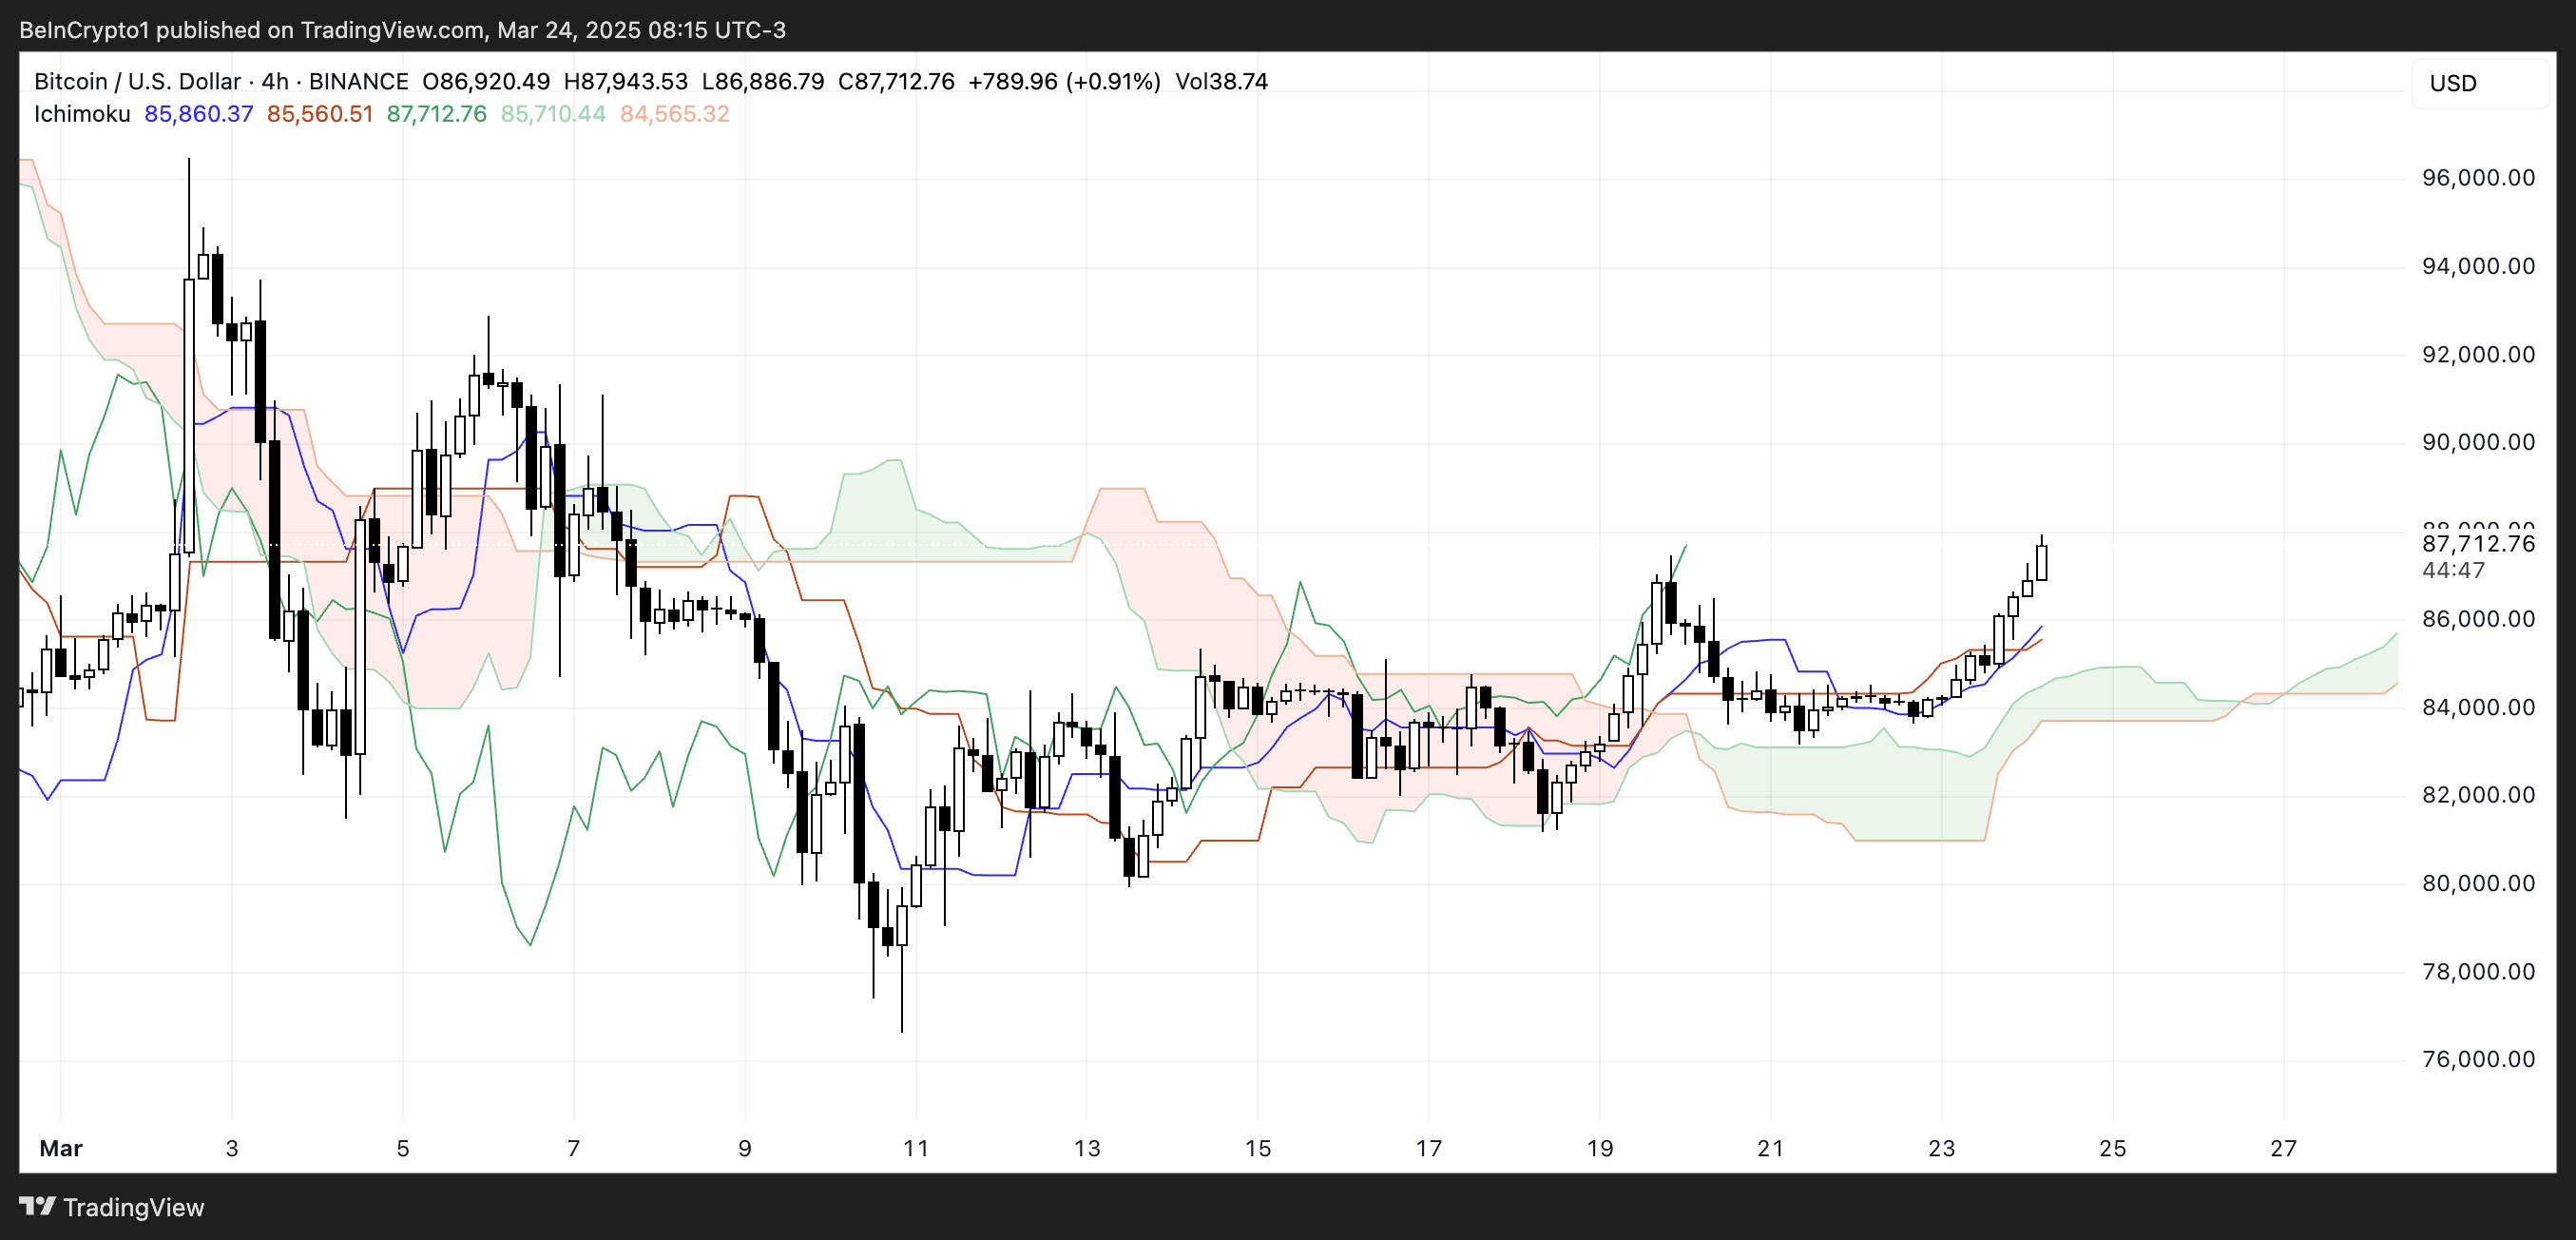
On the right side of the chart, the cloud formation (Kumo) changing from red to green indicates a sentiment shift from decline to rise. Price movement broke above the cloud after testing the support line multiple times in mid-March.
This breakout above the cloud suggests previous resistance potentially becoming support. Changes in the cloud's thickness during this period reflect market volatility and changes in trend direction confidence.
Will Bitcoin Recover to $100,000 Before April?
Bitcoin's moving averages are currently showing mixed signals. The overall trend is still downward, but short-term exponential moving averages are beginning to turn bullish, and the recent golden cross suggests rising momentum.
If this momentum continues and additional golden crosses occur, Bitcoin price could target key resistance levels. The first major resistance is at $92,920, and a successful breakthrough could push BTC to $96,484.
If the upward trend strengthens further, Bitcoin could test $99,472, potentially breaking $100,000 for the first time since February 3rd. This could be facilitated by five US economic events that may impact Bitcoin sentiment this week.
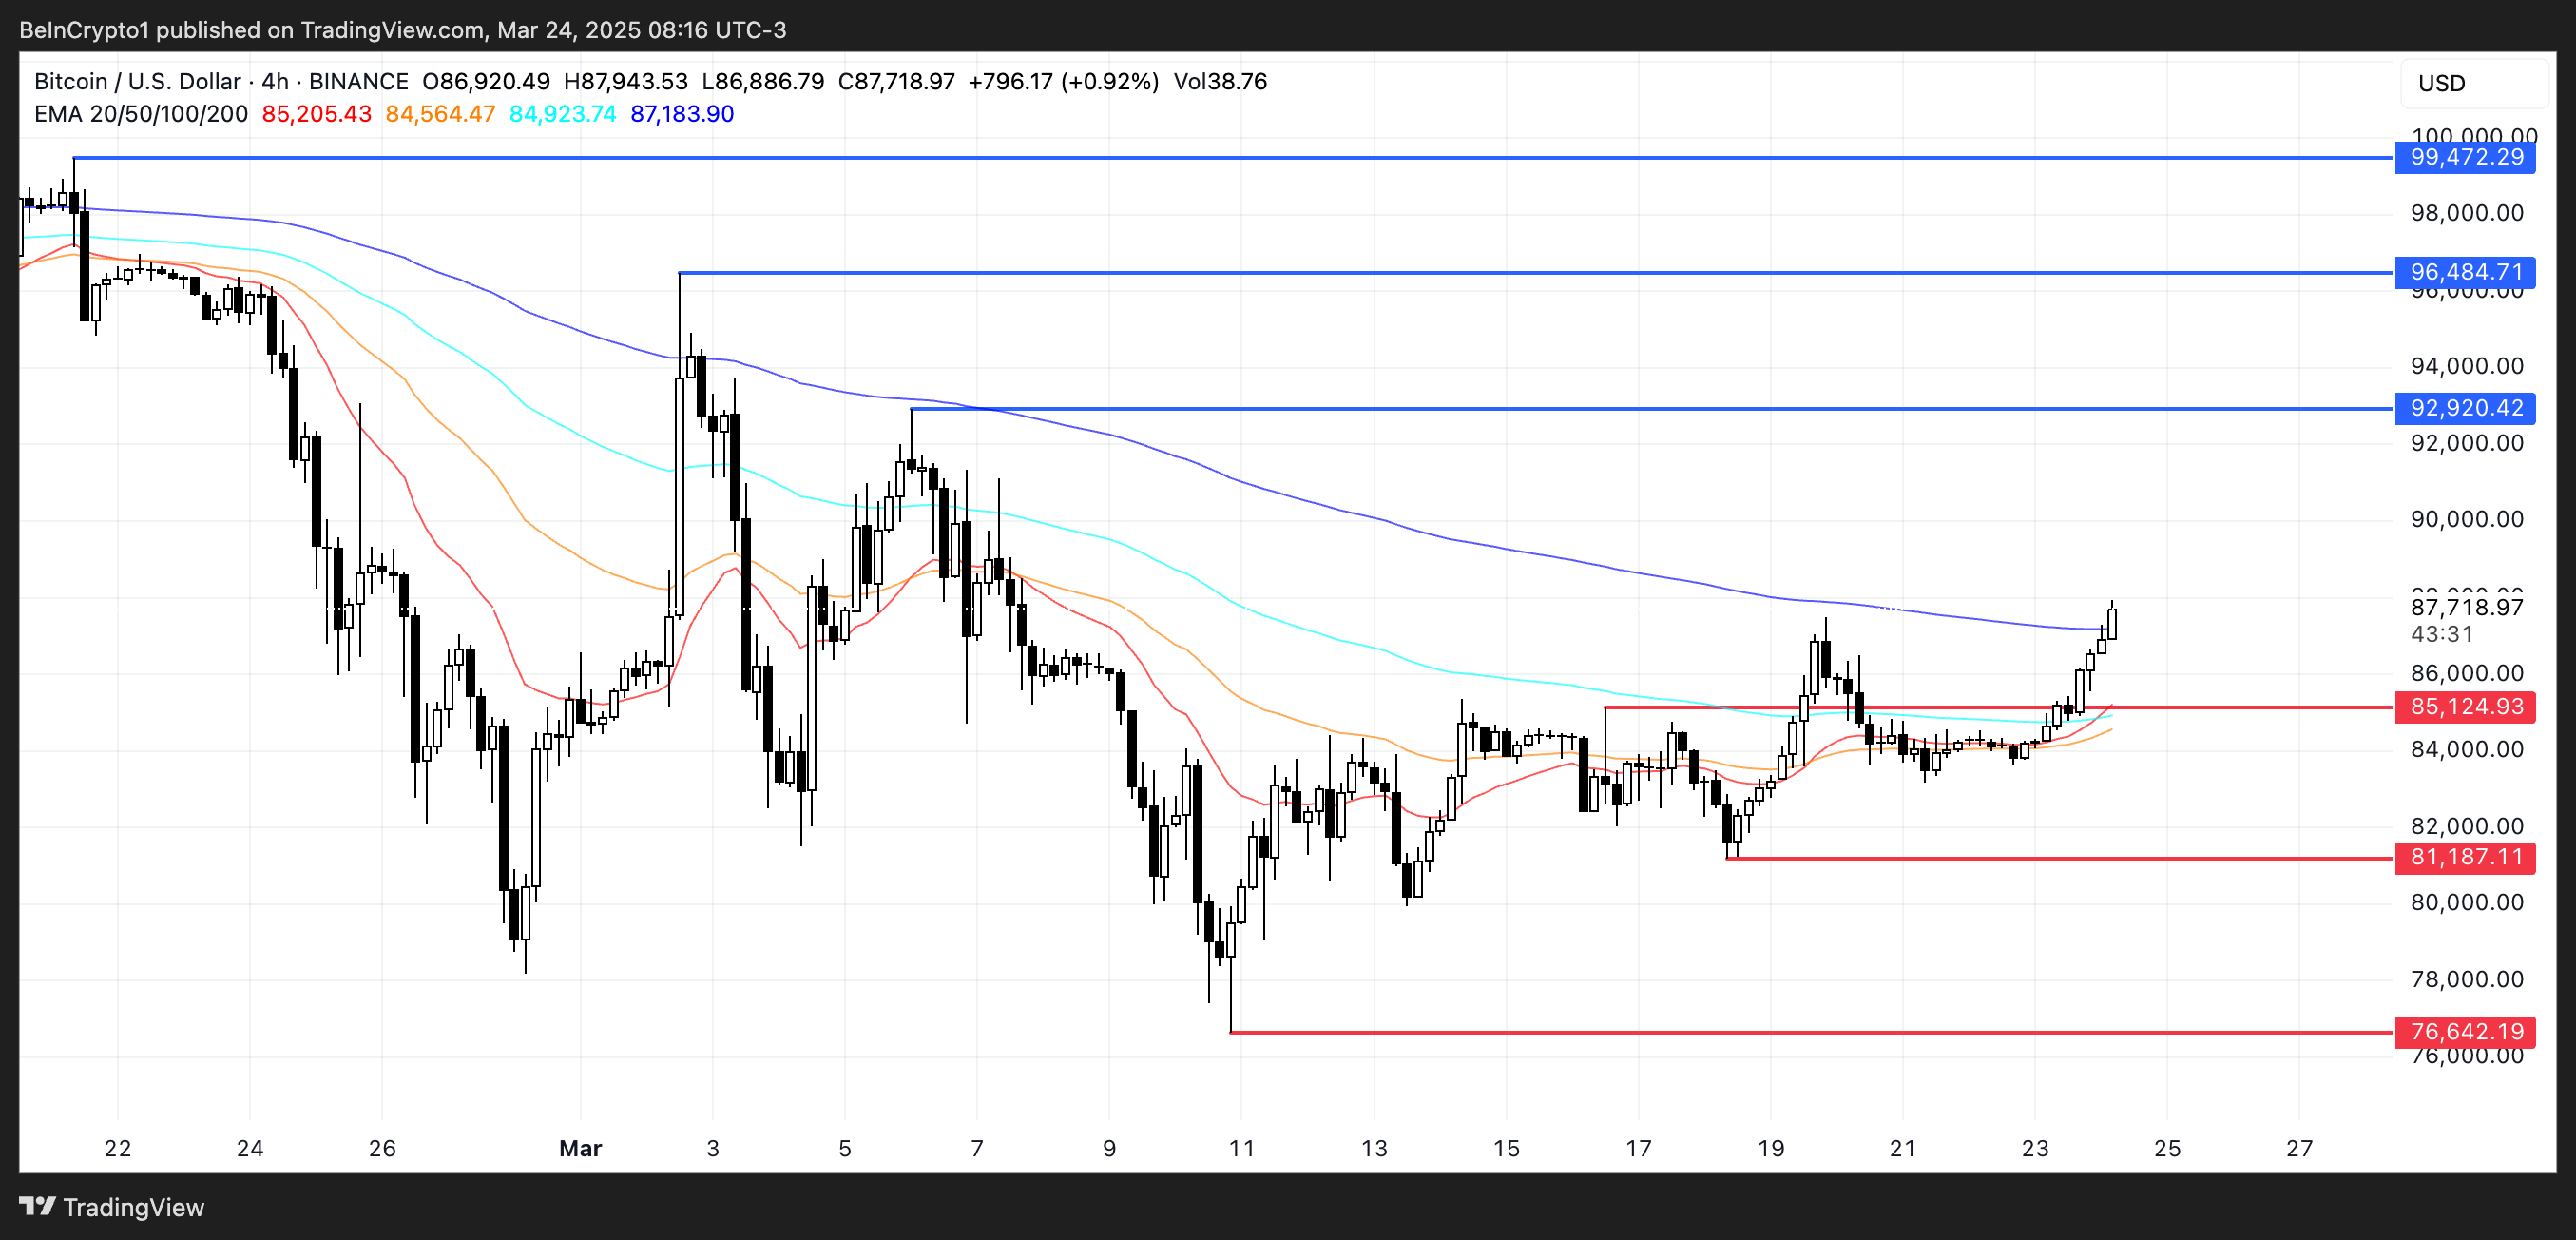
However, the upward scenario depends on sustained buying pressure. If upward momentum disappears and the overall downward trend resumes, Bitcoin might first retest the support level at $85,124.
A breakdown below this level could open a drop to $81,187, with further decline potentially pushing BTC back below $80,000.
In a more severe downward scenario, Bitcoin could revisit $76,642, reinforcing the downward bias.


