

Onyx Coin (XCN) was one of the best performing altcoins in January. Its market capitalization surged from $70 million on January 1 to $1 billion on January 26. However, it has declined by 23% over the past 30 days.
The Relative Strength Index (RSI) has dropped to 42, and the Average Directional Index (ADX) indicates that the downtrend is weakening, suggesting a potential correction phase. If XCN loses its key support at $0.0145, it could drop to $0.0075. However, if a bullish reversal occurs, it could test resistance levels at $0.0229, $0.033, and even $0.040.
Onyx Coin RSI, Buying Pressure Weakens
The RSI of Onyx Coin is currently at 42, down from 52.6 two days ago. It had previously risen from 29.2.
The Relative Strength Index (RSI) is a momentum indicator that measures the speed and change of price movements. It ranges from 0 to 100, with readings above 70 indicating overbought conditions and potential price corrections. Readings below 30 indicate oversold conditions and potential rebounds.
An RSI between 30 and 70 indicates a neutral trend without a strong directional bias.
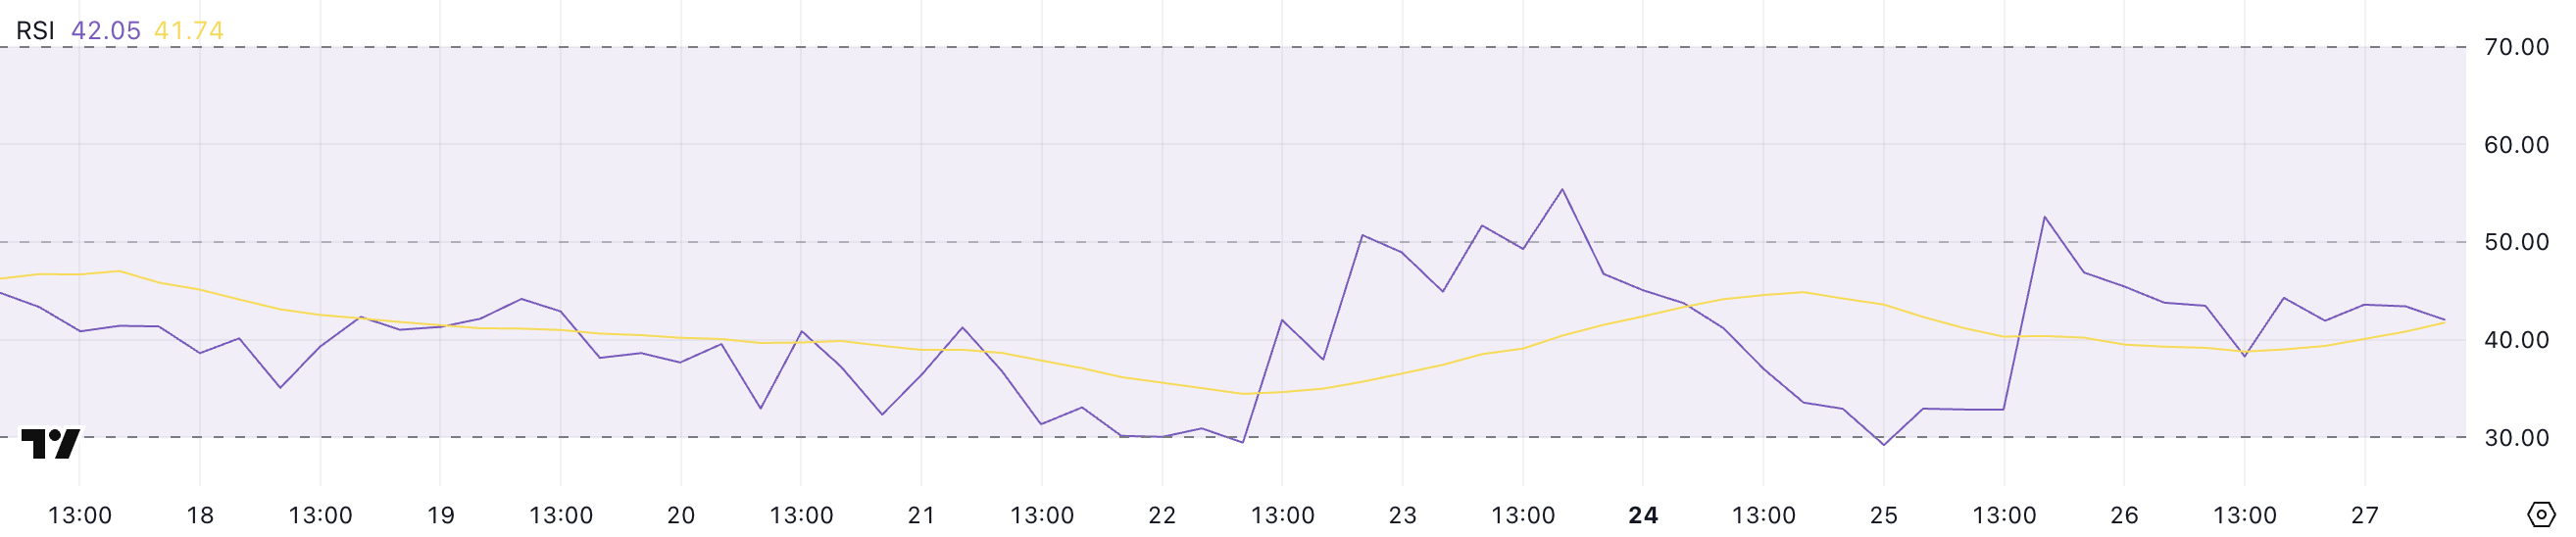
XCN's RSI has not been able to cross above 60 since January 30, indicating a lack of strong upward momentum.
The recent drop from 52.6 to 42 suggests that buying pressure is weakening. If the RSI continues to decline, it could signal further downside potential. This reflects a weakening of the bullish sentiment, and altcoins may become more vulnerable to sustained selling pressure.
If the RSI fails to recover above 50 soon, it could confirm a downtrend. This could lead to further price declines.
XCN ADX, Downtrend Fading
The ADX of Onyx Coin is currently at 15.6, down from 24.2 two days ago. The Average Directional Index (ADX) is a trend strength indicator that does not indicate the direction of the trend.
It ranges from 0 to 100, with readings above 25 indicating a strong trend, and readings below 20 indicating a weak or non-trending market.
An ADX below 20 suggests a high probability of price consolidation or lack of momentum.

The decline in XCN's ADX to 15.6 indicates that the trend is weakening. This suggests that the current downtrend is losing momentum.
The decline in ADX during a downtrend reflects a decrease in selling pressure and market uncertainty. This increases the likelihood of a price correction or consolidation.
However, without an ADX increase or directional change, XCN may not see a significant price reversal soon. If the ADX remains below 20, the price may continue to move without a clear direction.
Onyx Coin, Downtrend Could Deepen by 51%
The weakening of the downtrend and the decline in RSI suggest that altcoins may be entering a correction phase.
There is a nearby support level at $0.0145, and if it is lost, XCN could drop to $0.0075.

On the other hand, if a bullish trend emerges, XCN could test the resistance level of $0.0229. If it breaks through and Onyx Coin recovers the positive momentum from the previous month, it could continue to rise and test $0.033 or even $0.040.
This represents a potential upside of 154% from the current levels. However, for this bullish scenario to materialize, XCN needs to regain strong buying momentum and maintain it through the key resistance zones.

