

Hedera (HBAR) has fallen 37% over the past 30 days, and the current price is trading below $0.30 for almost a month. Technical indicators are still showing a downward trend, and the DMI is indicating a lack of clear direction and weak trend strength.
The Ichimoku Cloud also suggests that HBAR is struggling to break above key resistance levels, indicating that the downward pressure will continue. As the EMA lines are maintaining a downward trajectory, HBAR may see further declines if buying momentum does not return.
Hedera DMI Lacks Clear Direction
HBAR's Directional Movement Index (DMI) currently has an ADX of 13.5, down from 17.4 the previous day. The Average Directional Index (ADX) measures the strength of a trend regardless of direction, and a value below 20 generally indicates a weak or non-trending market.
In this case, Hedera's declining ADX suggests that the downtrend is losing momentum. This may indicate that the trend is not declining strongly enough and could enter a correction or consolidation phase.

Meanwhile, +DI has declined from 28.2 two days ago to 18.2, and -DI has dropped from 31 the previous day to 20. +DI measures upward momentum, and -DI measures downward momentum. The decline in both indicators suggests that selling pressure is decreasing, but buying interest remains weak.
Since -DI is still above +DI, Hedera is still in a downtrend. However, the narrowing gap between the two indicators suggests that selling pressure may be easing.
Going forward, if +DI crosses above -DI, this could signal the start of a reversal or a temporary pause in the current downtrend. Until then, HBAR's price movement is likely to remain in a downward trend or range-bound.
HBAR Ichimoku Cloud Paints a Bearish Picture
HBAR's Ichimoku Cloud chart is currently showing a downward trend. The price is trading below the red cloud (Kumo), indicating a continuation of the downtrend.
The conversion line (blue line) is below the base line (red line), further strengthening the bearish momentum. Additionally, the price is struggling to break above the base line, acting as resistance and suggesting that buying momentum is still weak.
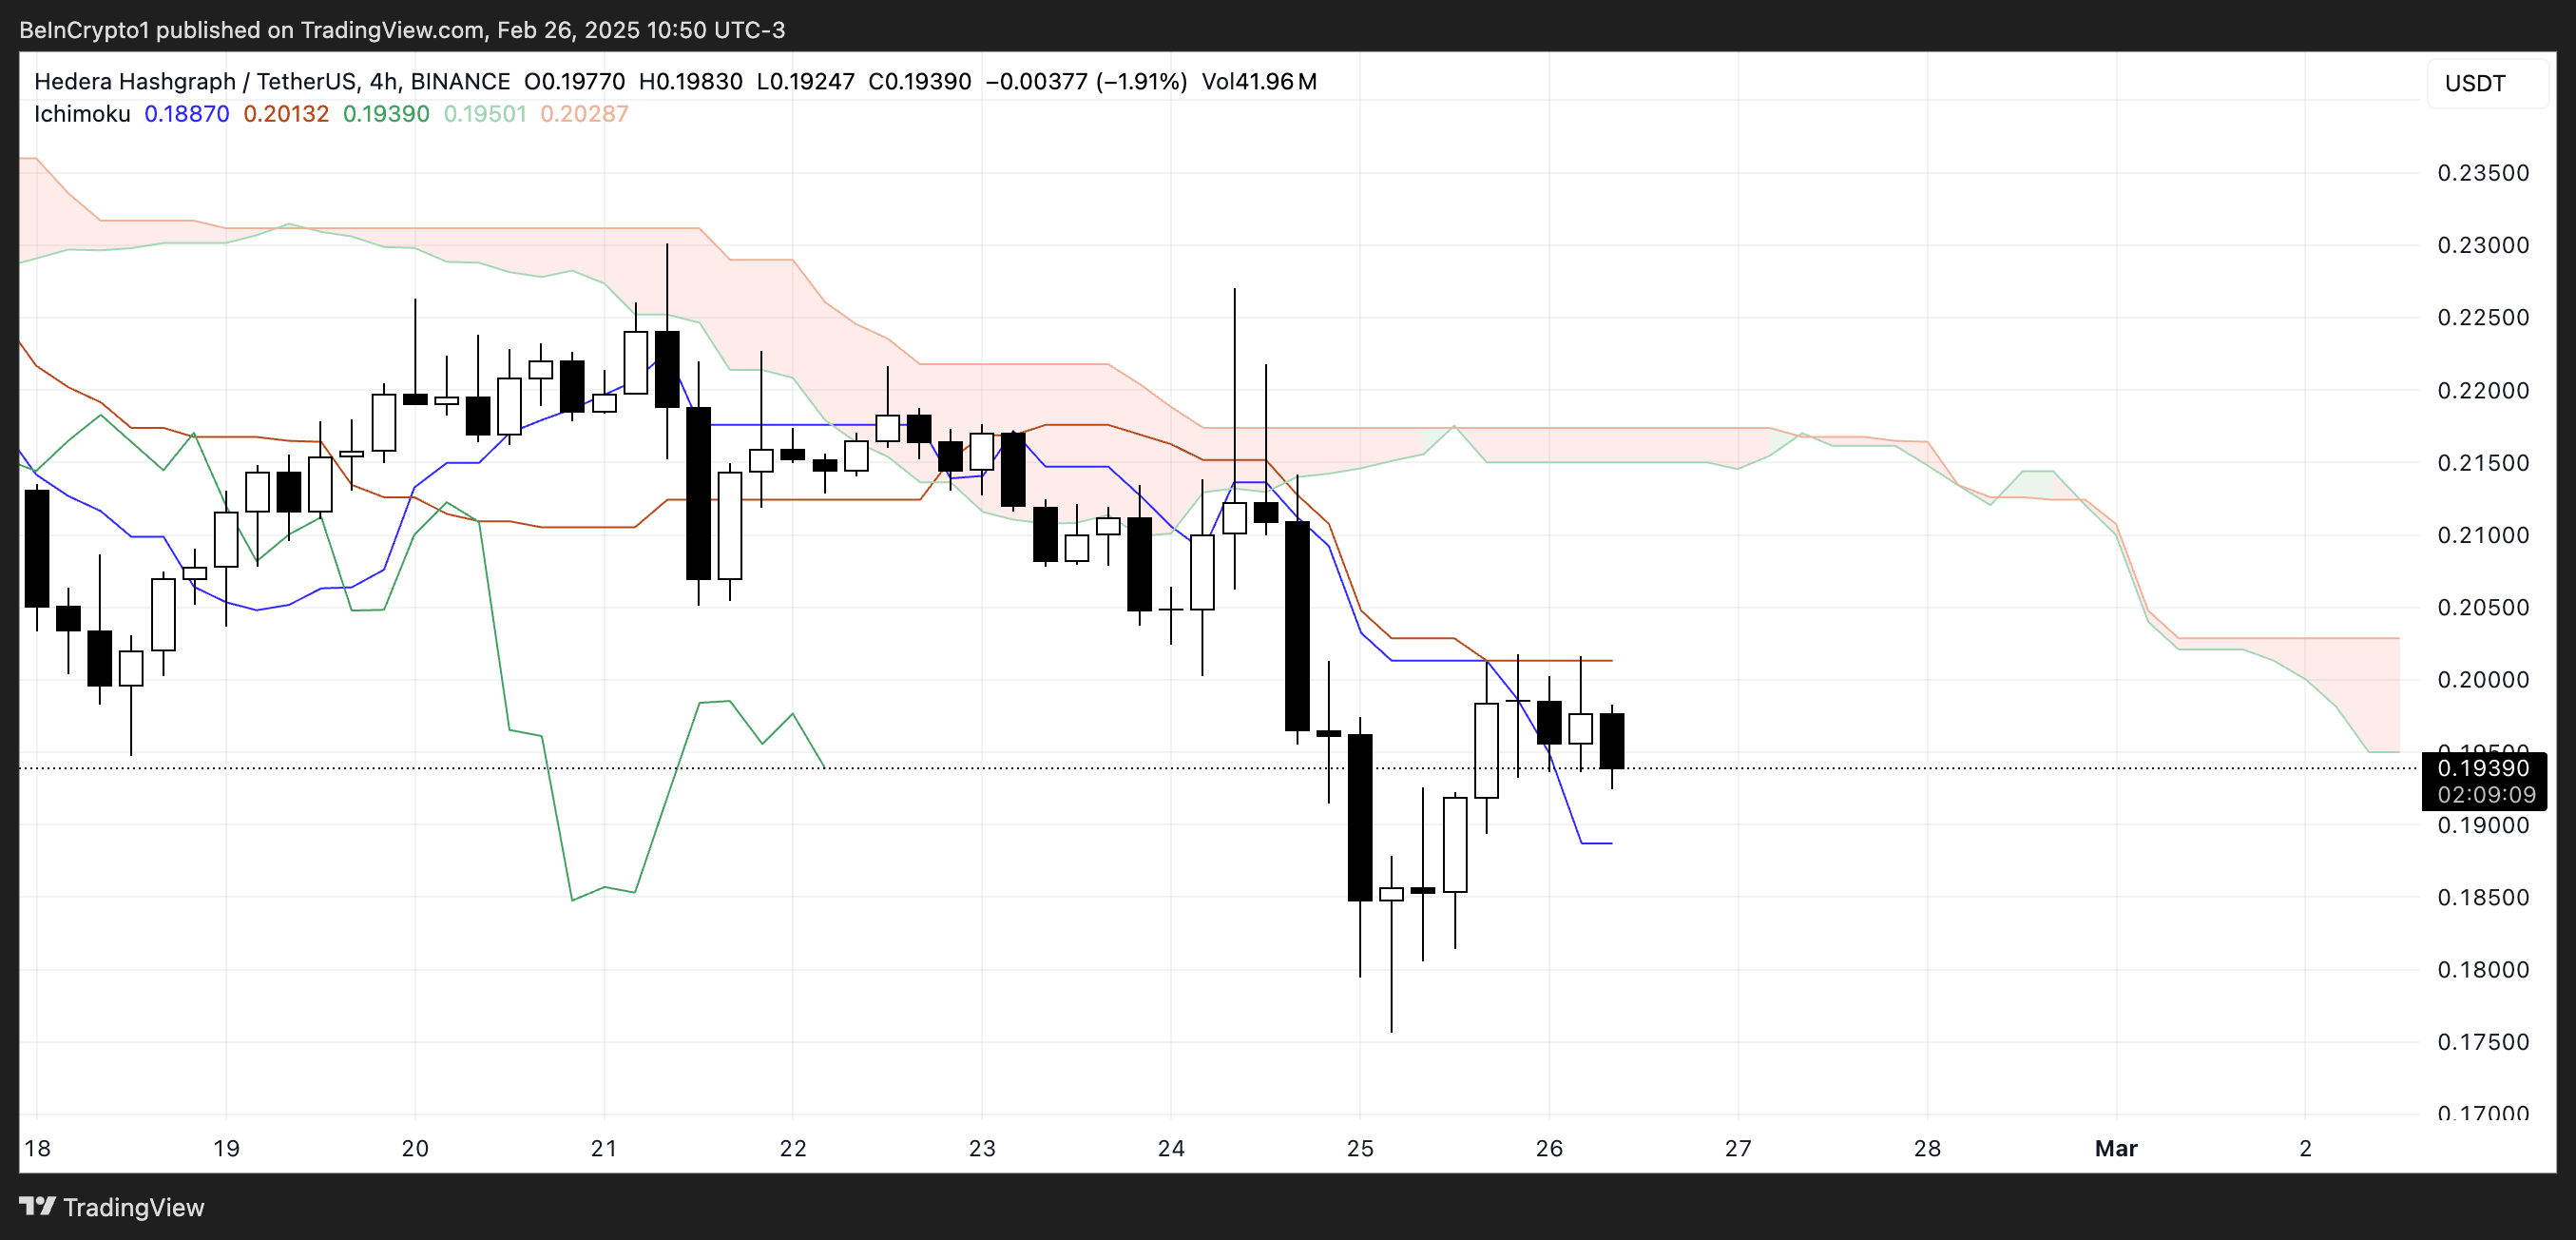
The leading span A (green line) is below the leading span B (red line), forecasting a bearish cloud ahead. This suggests that downward pressure is likely to persist in the near future.
Additionally, the distance between the current price and the cloud indicates that Hedera is in a strong downtrend. Unless the price breaks above the base line and moves towards the cloud, the downtrend is likely to continue.
Will Hedera Soon Drop to $0.12?
HBAR's EMA (Exponential Moving Average) is currently showing a downward trend, with the short-term EMA below the long-term EMA. This alignment indicates that the bearish momentum is dominant, and selling pressure is prevailing.
Recently, HBAR tested the $0.177 support level, which was maintained, but the risk of a retest remains. If the $0.177 support level is tested and not held, HBAR could further decline to $0.125, indicating a continuation of the downtrend.
The current EMA positioning suggests that the downtrend is more likely to continue unless a significant increase in buying interest occurs.
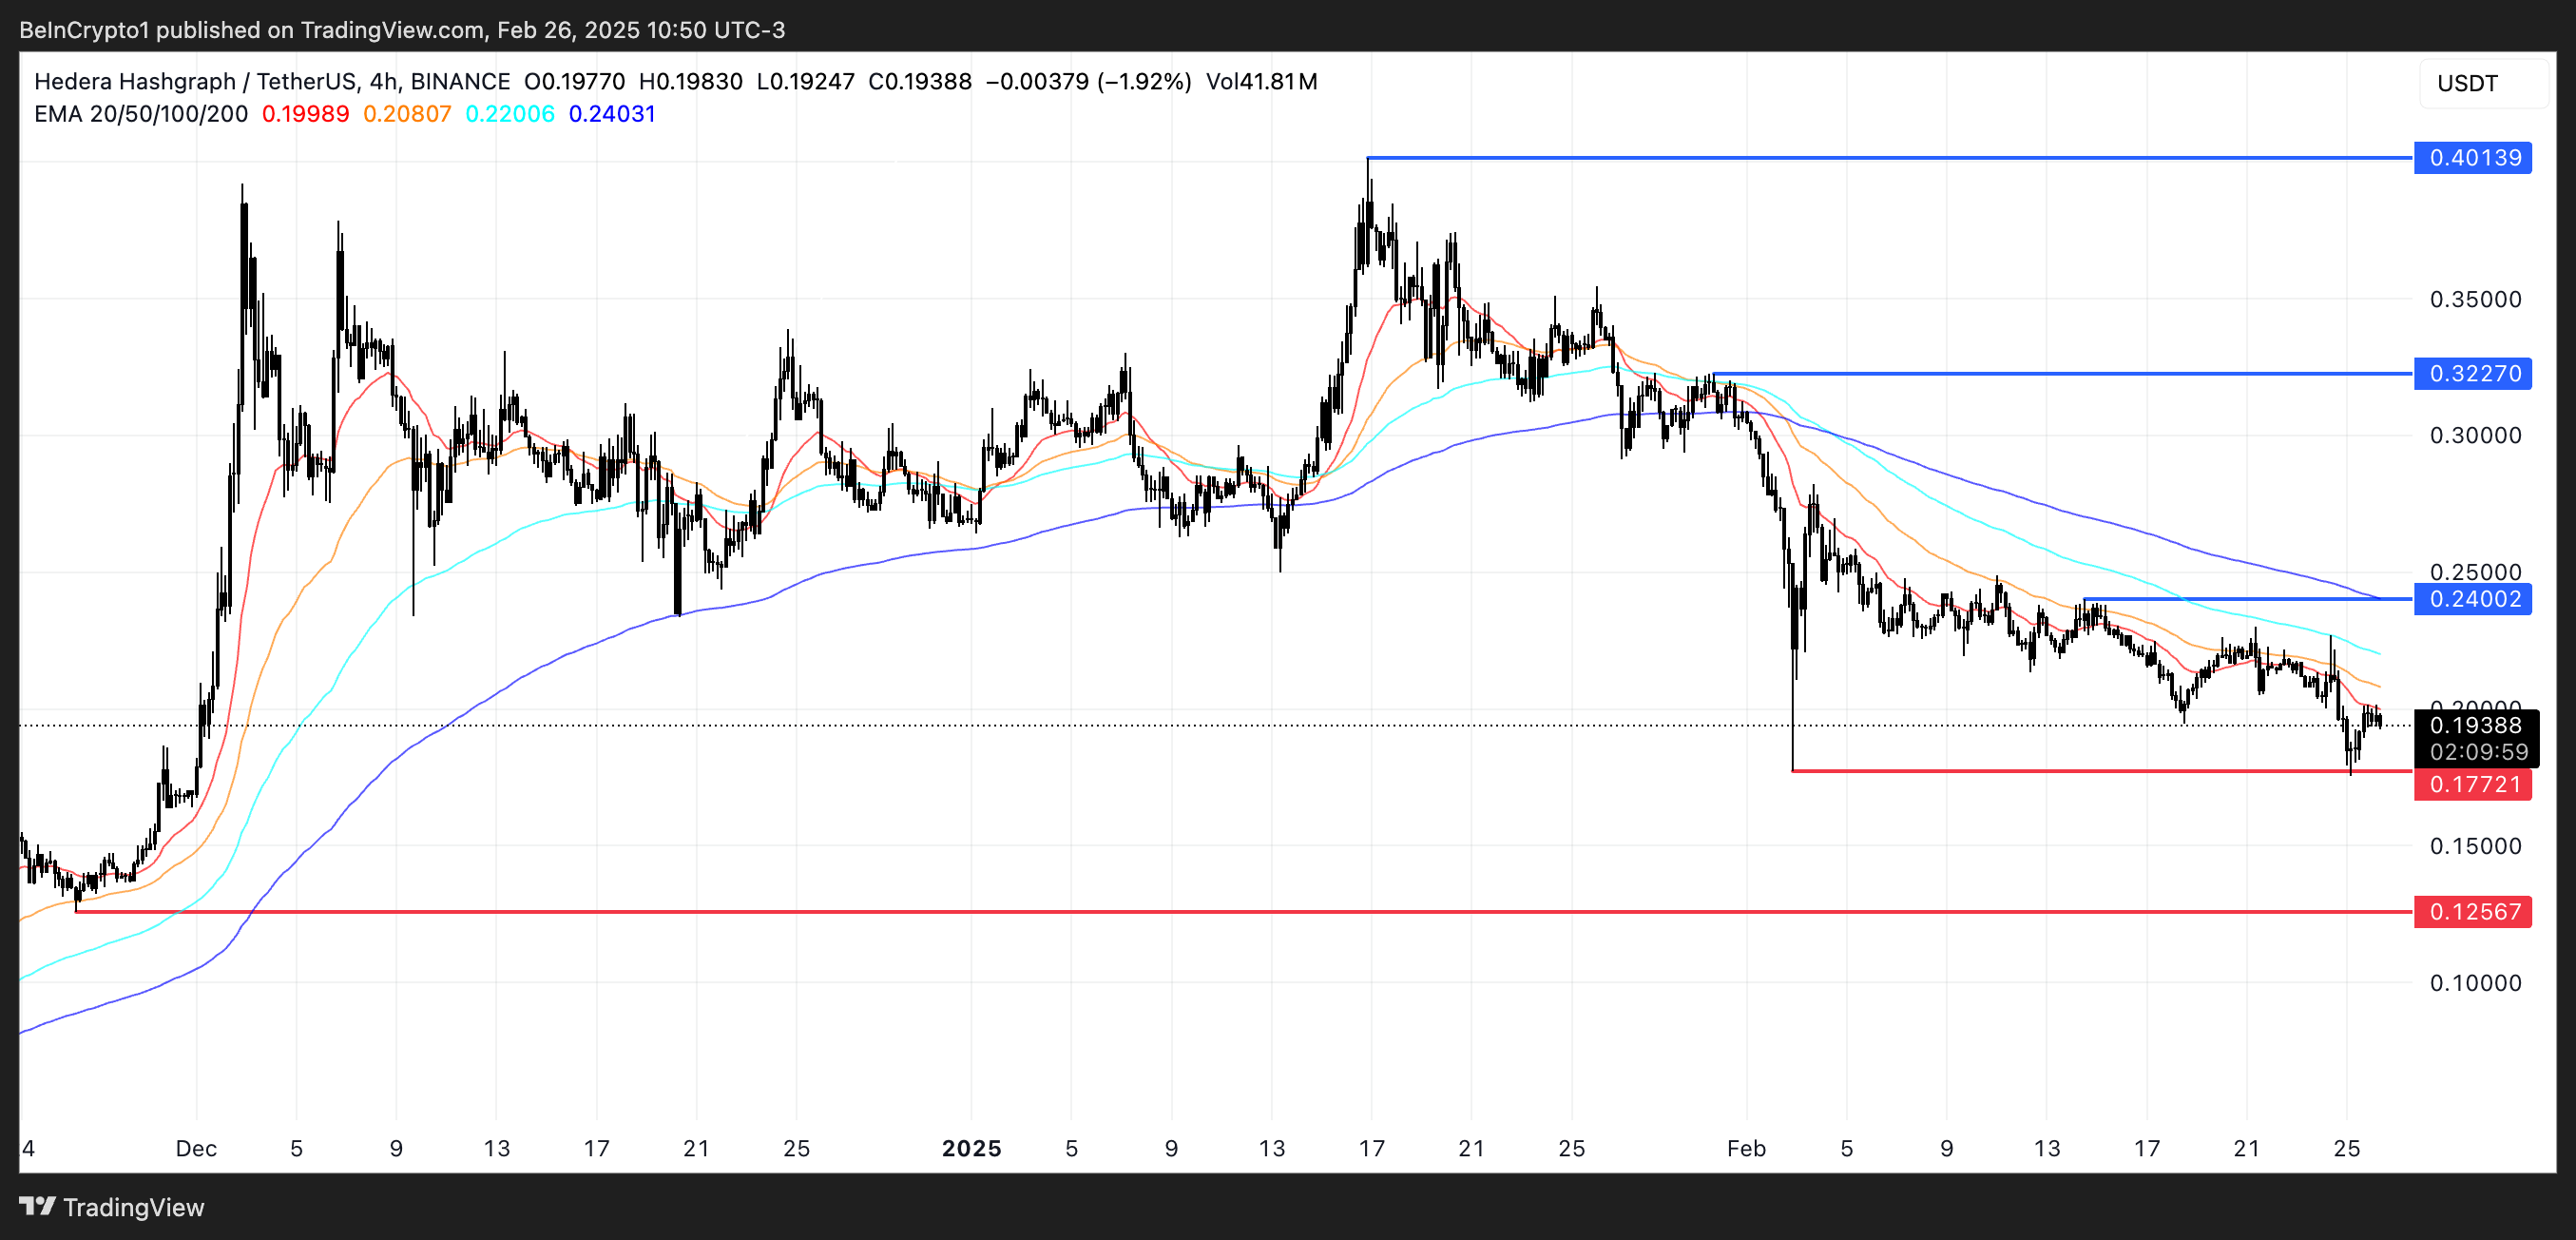
However, if the bearish momentum fades and the trend reverses, HBAR could test the $0.24 resistance level. Breaking above this level would signal a psychological shift, and the price could potentially rise to $0.32.
If the uptrend strengthens further, Hedera could climb to $0.40, a level not seen since 2021. For this bullish scenario to materialize, the short-term moving averages would need to cross above the long-term moving averages, signaling a reversal.
Until then, HBAR's price movement is likely to face pressure. The $0.177 support level will be crucial in determining the next direction.

